Scalability of the Example Transformation
The example transformation has been tested in the Amazon Cloud environment with the following conditions for all executions:
the same master node
the same input data: 1.2 GB of input data, 27 million records
three executions for each "node allocation"
"node allocation" changed between every 2 executions
all nodes has been of "c1.medium" type
We tested "node allocation" cardinality from 1 single node, all the way up to 8 nodes.
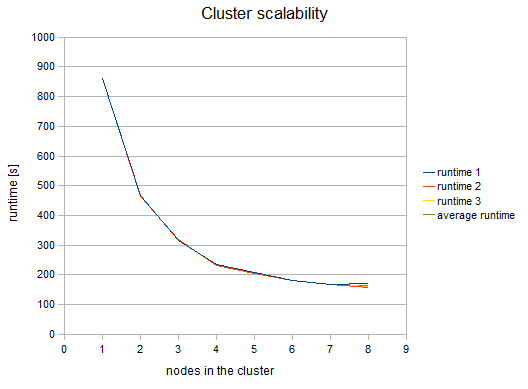
The following figure shows the functional dependence of run-time on the number of nodes in the cluster:

Figure 29.7. Cluster Scalability
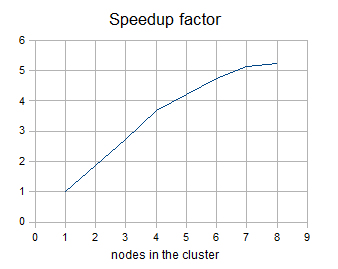
The following figure shows the dependency of "speedup factor" on the number of nodes in the cluster. The speedup factor is the ratio of the average runtime with one cluster node and the average runtime with x cluster nodes. Thus:
speedupFactor = avgRuntime(1 node) / avgRuntime(x nodes)
We can see, that the results are favourable up to 4 nodes. Each additional node still improves cluster performance, however the effect of the improvement decreases. Nine or more nodes in the cluster may even have a negative effect because their benefit for performance may be lost in the overhead with the management of these nodes.
These results are specific for each transformation, there may be a transformation with much a better or possibly worse function curve.

Figure 29.8. Speedup factor
Table of measured runtimes:
| nodes | runtime 1 [s] | runtime 2 [s] | runtime 3 [s] | average runtime [s] | speedup factor |
|---|---|---|---|---|---|
| 1 | 861 | 861 | 861 | 861 | 1 |
| 2 | 467 | 465 | 466 | 466 | 1.85 |
| 3 | 317 | 319 | 314 | 316.67 | 2.72 |
| 4 | 236 | 233 | 233 | 234 | 3.68 |
| 5 | 208 | 204 | 204 | 205.33 | 4.19 |
| 6 | 181 | 182 | 182 | 181.67 | 4.74 |
| 7 | 168 | 168 | 168 | 168 | 5.13 |
| 8 | 172 | 159 | 162 | 164.33 | 5.24 |