

|
|
|
When the query optimizer evaluates a query (such as the SQL statements select, insert, update, delete, and create table as), it generates a QEP showing how the query is executed. Once the QEP has been generated, it can be used one or more times to execute the same query. Because there are often many different ways to optimize a given query, choosing the best QEP can have a significant impact on performance.
You can display a diagram or graph of the QEP selected, which can be used to gain insight into how queries are handled by the query optimizer. Knowing how to read and analyze QEPs can allow you to detect, and often avoid, hidden performance problems. After examining a QEP you can, for example, decide that you need to optimize your database to provide the optimizer with better statistics, as described in Database Statistics.
Note: Examining QEPs can help you understand what is involved in executing complex queries in single-user situations. For multi-user performance issues, see the chapter "Understanding the Locking System."
|
|
|
The information that can appear on a QEP is as follows:
Indicates the table on which the query is being run or the secondary index, if any is selected by the query optimizer for execution of the query. This information is provided for orig nodes only (described under Type of Nodes in a QEP below).
Indicates the type of node. For example, Proj-rest identifies a projection-restriction node (described under Type of Nodes in a QEP below).
Indicates the storage structure in use, as follows, where key is the primary key, and NU indicates that the key structure cannot be used:
B-tree(key|NU)
Hashed(key|NU)
Heap
Isam(key|NU)
Indicates the total number of pages involved at the node, and the total number of tuples (rows).
Indicates the cumulative amounts of cost that are anticipated at each stage in the execution of the query. This cost is a blend of the CPU consumption and the number of disk I/Os involved in plan execution. The information is shown in the following form:
Because these values are cumulative up the tree, the top node carries the total resources required to execute the query. The cost involved in executing a specific node is, therefore, the values for that node, minus those of the child node (or both child nodes in the case of a join node).
The QEP graph you see in VDBA indicates both the cumulative cost and the cost for the individual node. For more information, see Viewing QEP Node Information in online help.
|
|
|
In general, it is a good idea to test run a query (that is, view the QEP).
In VDBA, if you open the SQL Scratchpad window and click Execute QEP, you automatically see the query execution plan in a graphical form. For step-by-step instructions, see Viewing the Query Execution Plan in online help.
From a terminal monitor or embedded SQL, you can see the QEP by using the set qep statement. On the set statement, the [no]optimizeonly, [no]qep, and joinop [no]timeout clauses pertain to QEPs. For more information, see the SQL Reference Guide. The QEP is displayed in text-only format when using SQL.
|
|
|
To control whether QEPs are generated using an operating system environment variable, issue the following commands:
Windows:
set ING_SET=set qep
UNIX:
C shell:
setenv ING_SET "set qep"
Bourne shell:
ING_SET = "set qep"
export ING_SET
VMS:
define ING_SET "set qep"
|
|
|
In a terminal monitor, a QEP is displayed as a tree, where each node has one or two children:
Parent
/ \
Child Child
/
Parent
/ \
Child Child
Only join nodes have two children. Other nodes have a left child only. Information on node types is provided in Types of Nodes in a QEP.
The tree is read from bottom to top and from left to right, starting with the child nodes at the bottom, going up to the intermediate child nodes, if any, and finally up to the first parent node:
|
|
|
The bottom up approach in the tree diagram mirrors the flow of data during the execution of a query plan.
Rows are read in the leaf nodes of the query plan, where clauses are applied to reduce the number of rows as soon as possible, with qualified rows being passed up through the remaining nodes of the query plan.
Intermediate plan nodes can sort the data or join it to rows from other tables.
Each successive node performs some refinement on the rows received from below. The final result rows emerge from the top of the plan as requested by the query.
|
|
|
In the SQL Scratchpad window, you can show the tree diagram in one of two modes:
Note: A query that has been modified to include views, integrities, and/or grants, is more involved. The QEP diagram for an involved query (as shown by set qep) can be very wide. On a printout, the diagram can even wrap so that similar levels in the tree appear on different levels. You can find it easier to read such a QEP if you cut and paste the diagram into the correct levels.
|
|
|
In VDBA, QEP diagrams appear in the query information pane as a graph, as shown in this example:
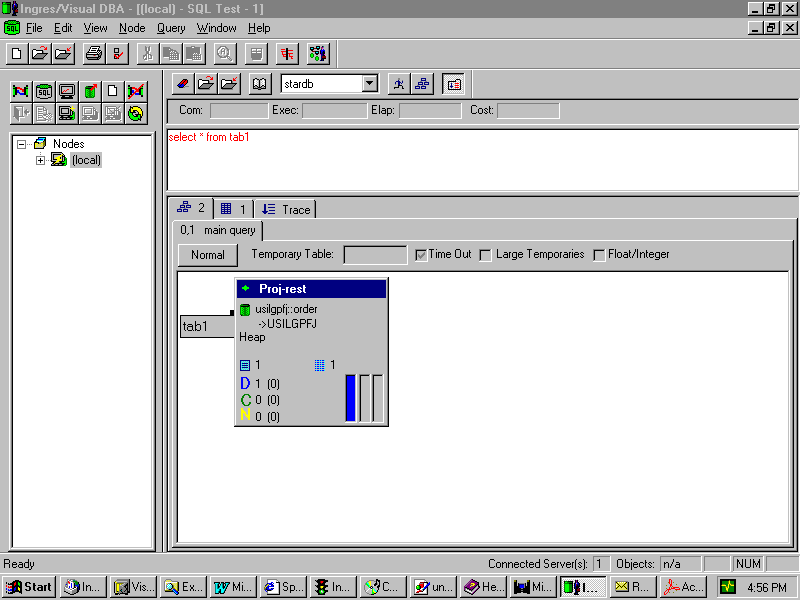
For a detailed description of each element in the graph and the meaning of the colors, see Viewing QEP Node Information in online help.