Msc-generator allows you to collapse boxes and entity groups. This way you can show only a simplified view of the procedure described by the chart text. E.g., instead of many arrows comprising a part of the procedure, a simple box is shown as a summary.
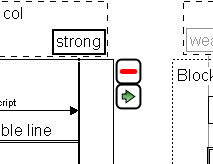
If you move the mouse over a chart element that can be collapsed (or is already collapsed), control icons appear at its top right corner. The control with the minus sign collapses the element, the control with the plus sign expands a collapsed element, while the green arrow collapses the element into a block arrow. The last icon will only appear for boxes, which are not part of a box series (Drawing Boxes).
You can disable the showing of such controls via the red plus button on the Chart pane.
Expanding and collapsing can also be set via the ‘collapsed’ attribute and
hence is available for the command-line version, as well. It is most useful, however,
for interactive work. Any collapse/expand setting via the GUI overrides the one
specified by attributes. Such overrides are saved with embedded charts, but naturally
not when the chart is saved to disk as text.
If you double click any element that has controls (can be collapsed/expanded) the first control is activated (even if controls are not shown). This essentially toggles collapse/expand status.