Using Visual Explain
To run Visual Explain, first open a connection to a database:
Click on the arrow of the combo box that is on the right side of the Visual Explain window in the Tool Bar. A list of the databases you configured in the Section called Configuring a Connection to a Database appears.
Select a database to connect to.
Depending on whether or not Save Database Passwords is enabled (discussed in the Section called Configuring Visual Explain's Operation), you may need to enter the database password in a pop-up window.
After this is done, if the connection is successful, the database's connection name appears in the Tool Bar.
Running and Storing SQL Commands
With a connection to a database open, type SQL commands, separated by semicolons, into the SQL Entry Area.
To run SQL commands, click on the blue "Explain/Explain Analyze" icon
 (or from the Statement menu, select Explain or
Explain Analyze).
Only the first SQL statement is explained.
(or from the Statement menu, select Explain or
Explain Analyze).
Only the first SQL statement is explained.
To explain a statement other than the first, just highlight the command that you want to run and click on the blue "Explain/Explain Analyze" icon. If you highlight more than one SQL statement, only the first is explained.
To store SQL commands for future use, click on the "save" icon. You are prompted for a filename.
To load SQL command files, click on the "Open" icon. To run those commands, click on the blue "Explain" icon (or from the Statement menu, select Explain or Explain Analyze).
The output from the EXPLAIN command is displayed in the Visual Explain output window.
 | Other Output Options |
|---|---|
You can view a text version of the contents of the Visual Explain output window by clicking on Window -> Show EXPLAIN Output (or Window -> Show EXPLAIN VERBOSE Output). You can save a text version of the contents of this window by right-clicking on it, and entering a file name when prompted. You can see an overview of the contents of the Visual Explain output window by clicking on Window -> Show Plan Overview. |
An Example: Analyzing the regression Database
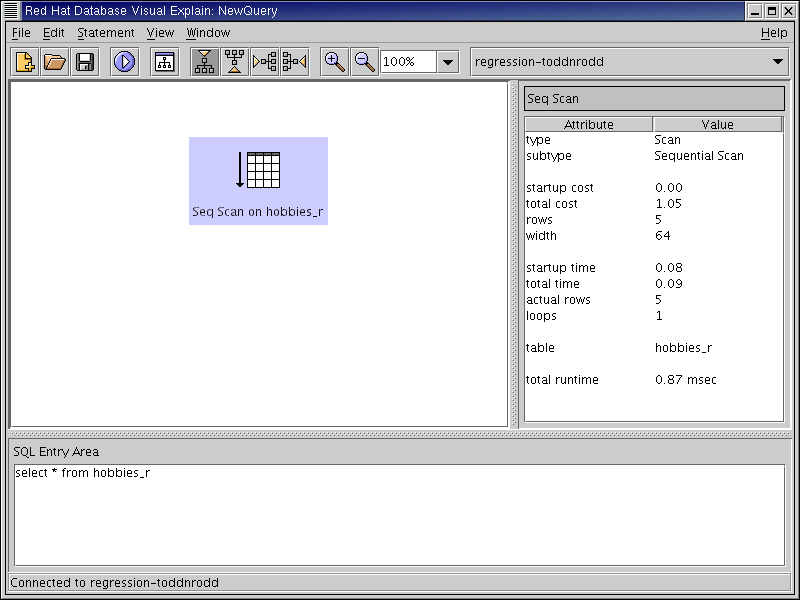
To begin, EXPLAIN the following statement:
SELECT * FROM hobbies_r;
Visual Explain displays the "Scan" icon above the caption "Seq Scan on hobbies_r".
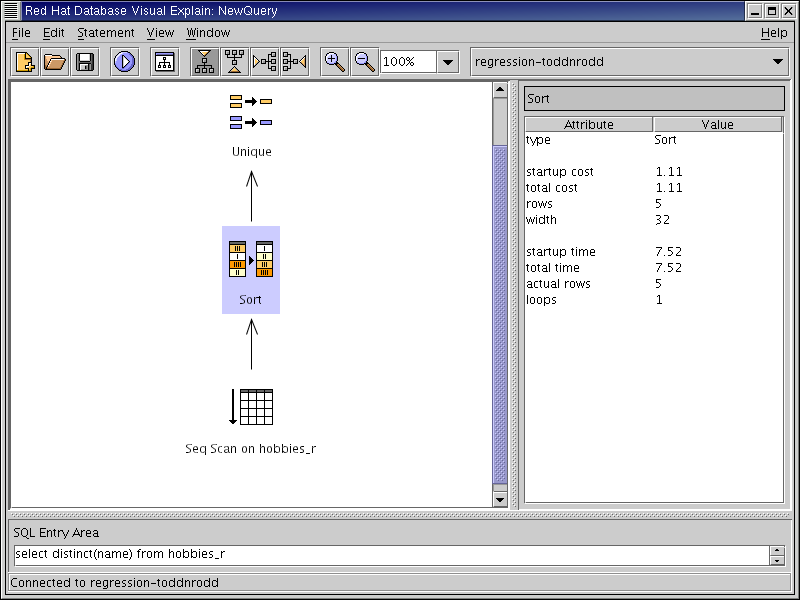
Next, select a distinct entry from one of the tables:
SELECT DISTINCT (name) FROM hobbies_r;
The Visual Explain display now contains the unique and sort icons as well.
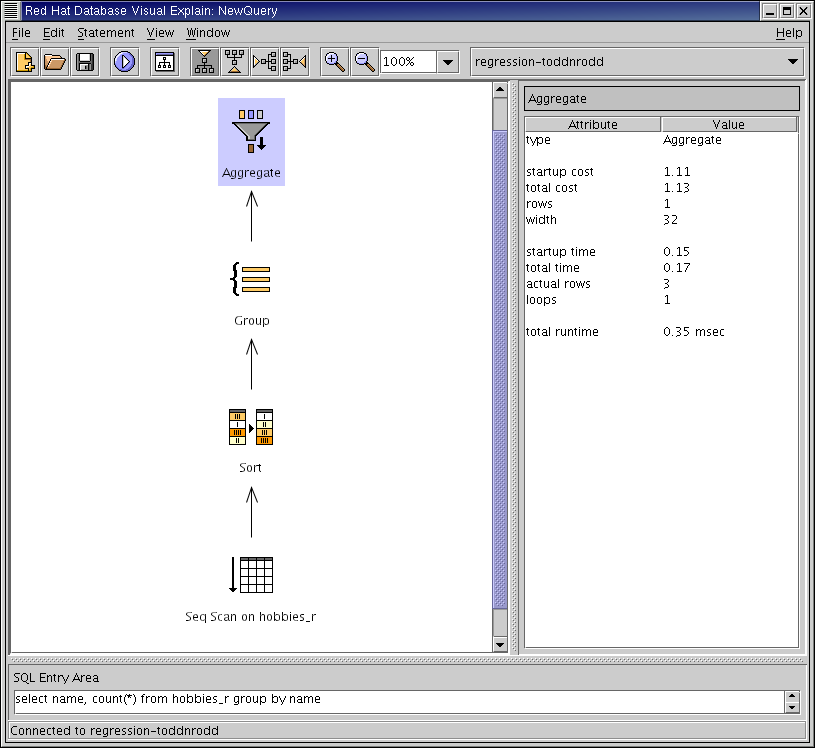
Next, run the following command:
SELECT name, count (*) FROM hobbies_r group BY name;
Visual Explain now displays the group and aggregate icons instead of sort all unique.
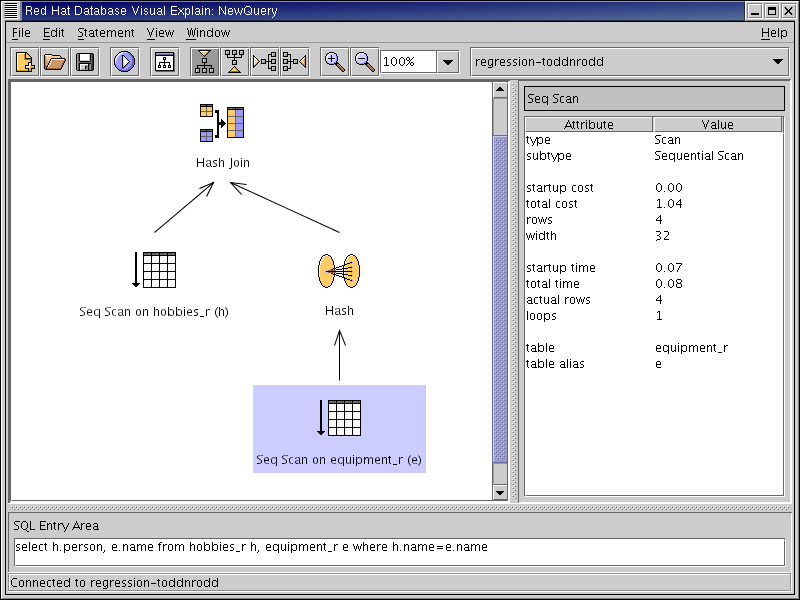
Run a command that lists all people, hobbies, and their equipment:
SELECT h.person, e.name
   FROM hobbies_r h, equipment_r e
   WHERE h.name=e.name;
Visual Explain displays a hash, a hash join, and some sequence scans.
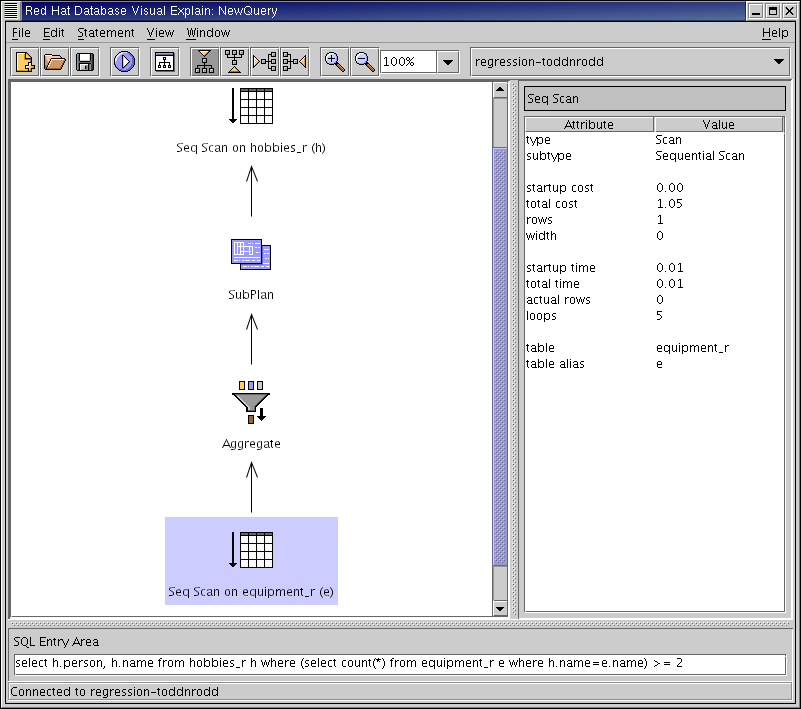
Finally, run the SQL command:
SELECT h.person, h.name
FROM hobbies_r h
WHERE (SELECT count(*)
      FROM equipment_r e
      WHERE h.name=e.name) >= 2;
Visual Explain display now contans a subplan.
Understanding the Visual Explain Output
The table that follows describes the Visual Explain icons.
Table 5-1. Visual Explain Icons
| Node | Description | Icon |
|---|---|---|
| Aggregate | Produce one value from multiple input rows. |  |
| Append | Combine rows from multiple input nodes. |  |
| Group | Organize input rows into groups. |  |
| Hash | Select rows using a hash. |  |
| Initplan | Process an un-related sub-query. |  |
| Join | Combine rows from two input nodes. |  |
| Limit | Select a certain number of rows. |  |
| Materialize | Create a temporary table. |  |
| Result | Process constant qualifications. |  |
| Scan | Scan a relation for certain rows. |  |
| SetOp | Perform a set operation. |  |
| Sort | Place input rows in some order. |  |
| SubPlan | Process a sub-query. |  |
| Unique | Discard all duplicate rows. |  |
Manipulating the Visual Explain Display
You can rotate the display by clicking on the "orientation" buttons (or from the View menu, select Orientation -> direction). You can zoom in or out by clicking on the "zoom" buttons (or from the View menu, select Zoom In or Zoom Out, or by choosing a value from the xx% drop-down list).
Depending on the amount of information in the plan and the size of the icons used in the display, you may not be able to view the entire plan at one time. To move the viewing area to another part of the plan, first open the Plan Overview window. The blue rectangle shows the current view in the main panel. To move the view to another area, click in that area in the Plan Overview. (Note that grayed areas are not accessible.)