Windows Store Apps: Debugging on IL2CPP Scripting Backend
Although IL2CPP does not have a C# debugger at this time, it’s still possible to debug generated C++ code using Visual Studio.
Class and method naming in generated C++ code
IL2CPP classes look like this: <ClassName>_t#number, where <ClassName> is plain name of a class, while #number is a unique type number. #number is not present on some of the core types. For example:
String_t
Object_t
Type_t
Char_t34
StringBuilder_t26
GuidParser_t1539
IL2CPP methods look like this: <ClassName>_<MethodName>_m#number, where <ClassName> is the plain class name of methods declaring type, <MethodName> is a plain method name and #number is unique method number. For example:
GuidParser_ParseHex_m10003
ConfigurationSection_DoDeserializeSection_m1275
String_Format_m4102
Mathf_Sqrt_m289
Thing_Start_m1
Static field structures are named like this: <ClassName>_t#number_StaticFields, where the first part of the structure name is identical to the declaring type, for example:
StringBuilder_t26_StaticFields
Thing_t24_StaticFields
Furthermore, above each class/method definition there is a C++ comment stating full class/method name. For example:
// System.String
struct String_t : public Object_t
{
    // System.Int32 System.String::length
    int32_t **_length_0;
    // System.Char System.String::start_char
    uint16_t **_start_char_1;
};

// System.Text.StringBuilder
struct StringBuilder_t26  : public Object_t
{
    // System.Int32 System.Text.StringBuilder::_length
    int32_t ****length_1;
    // System.String System.Text.StringBuilder::_str
    String_t* ****str_2;
    // System.String System.Text.StringBuilder::_cached_str
    String_t* ****cached_str_3;
    // System.Int32 System.Text.StringBuilder::_maxCapacity
    int32_t ****maxCapacity_4;
};

// System.Void MyData::.ctor()
extern "C" void MyData**ctor_m0 (MyData_t2 * **this, const MethodInfo* method)
{
    ...
}

// Thing
struct Thing_t24 : public MonoBehaviour_t25
{
    // MyData Thing::m_Data
    MyData_t2 * **_m_Data_2;
    // System.Text.StringBuilder Thing::m_Builder
    StringBuilder_t26 * **_m_Builder_3;
};
struct Thing_t24_StaticFields
{
    // System.Int32 Thing::s_SomeStaticField
    int32_t **_s_SomeStaticField_4;
};
Observing variable values
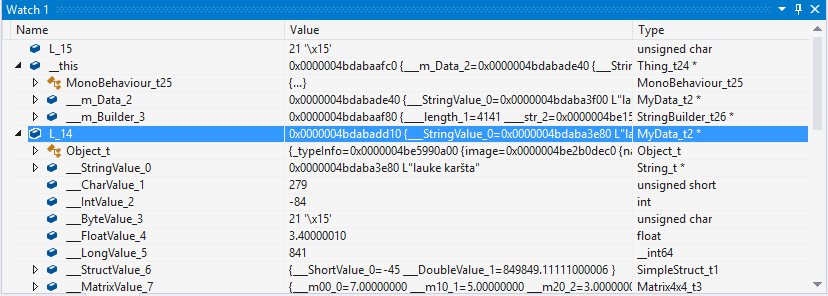
One of the most important parts of debugging is observing values of various variables. Visual Studio allows to do that relatively easily by either mousing over the variable of adding it into the watch window. For example:


Observing static fields is a little bit harder. In IL2CPP, static fields are stored on a TypeInfo instance itself. So in order to observe a static field, we’ll first need a pointer to TypeInfo structure of that type. These pointers are in scope of methods that use them, but after observing it once, it will remain at the same memory address for the duration of application run. TypeInfo structure has “static_fields” field, which is a pointer to a memory block containing static fields for that particular type. To view the actual values, this pointer has to be cast to appropriate static field structure: each type has its own. For example, let’s observe the static fields of class Thing_t24:

Investigating exceptions
IL2CPP uses native C++ exceptions to implement .NET exceptions. When any exception is supposed to be thrown, IL2CPP throws Il2CppExceptionWrapper object, which is defined as the following:
struct Il2CppExceptionWrapper
{
    Il2CppException* ex;

    Il2CppExceptionWrapper (Il2CppException* ex) : ex (ex) {}
};
These exception objects can be easily investigated in the watch window:

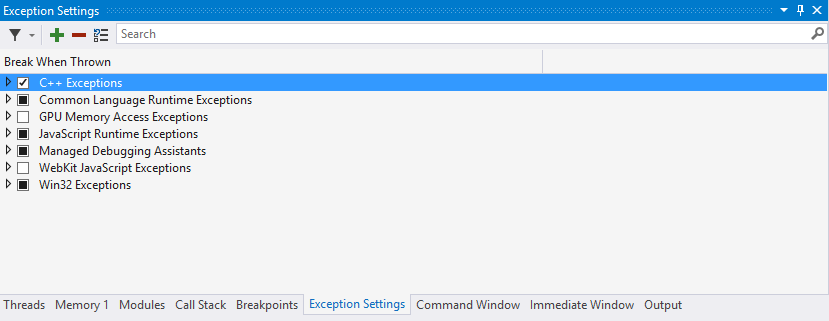
Lastly, it might be beneficial to enable debugger-break on exception so the source of the exception can be caught red-handed. To do so, hit CTRL+ALT+E in Visual Studio, and make sure that C++ exceptions checkbox is checked in the opened window:

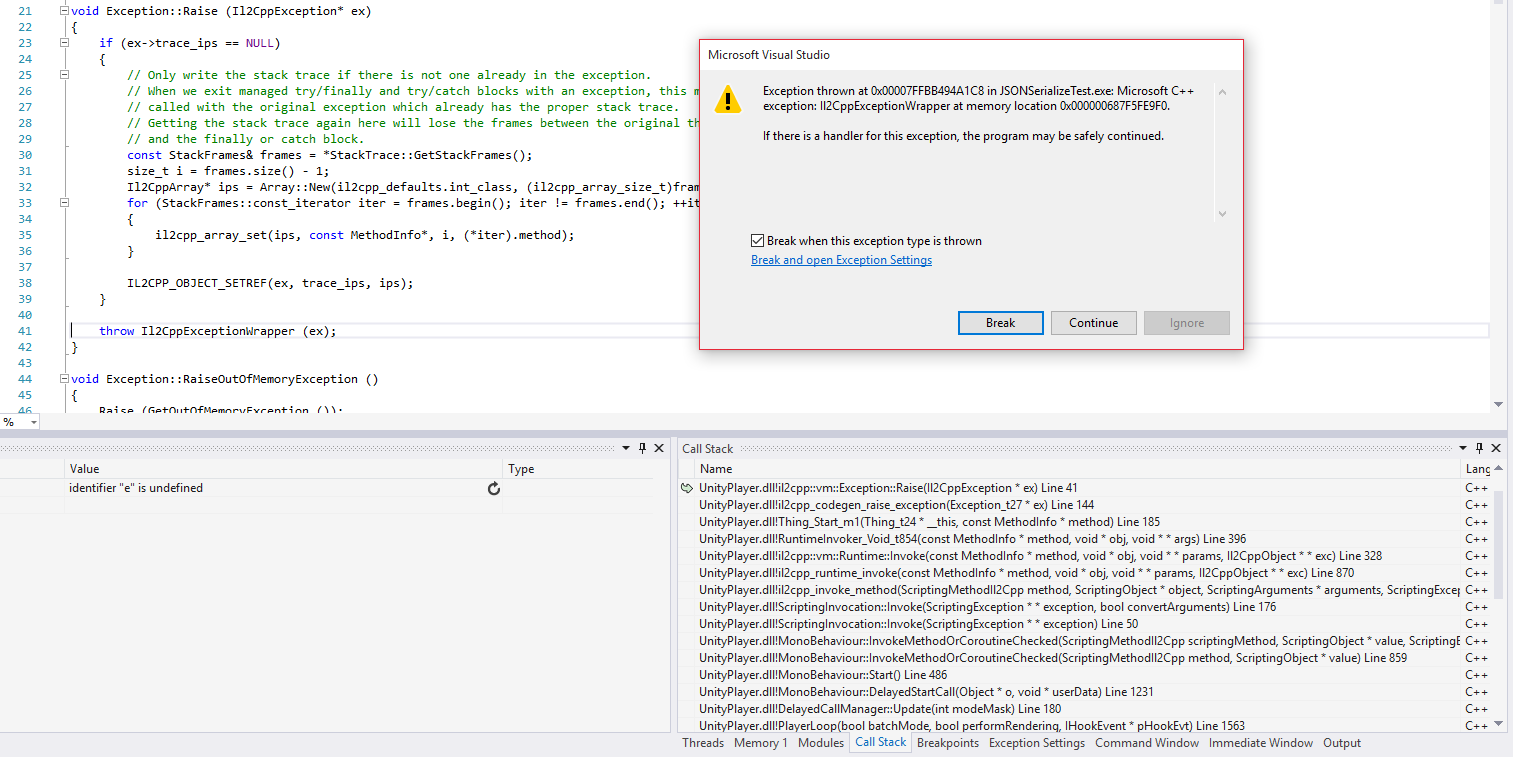
After enabling this setting, Visual Studio will automatically stop execution whenever an exception is thrown:
