User configurable graph of the captured network packets.
You can define up to five differently colored graphs.
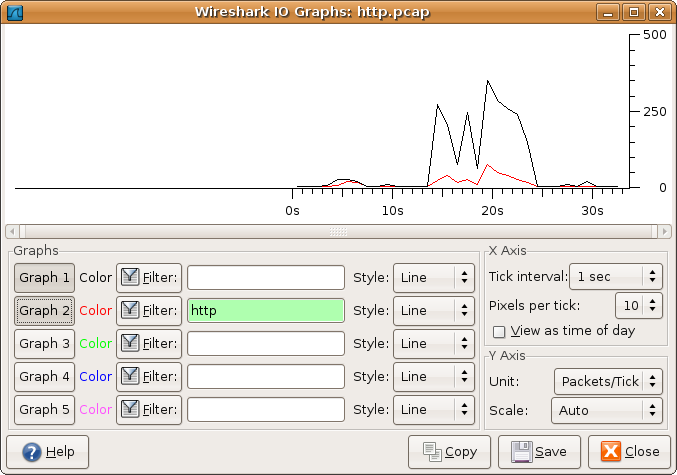
The user can configure the following things:
Graphs
- Graph 1-5: enable the specific graph 1-5 (only graph 1 is enabled by default)
- Color: the color of the graph (cannot be changed)
- Filter: a display filter for this graph (only the packets that pass this filter will be taken into account for this graph)
- Style: the style of the graph (Line/Impulse/FBar/Dot)
X Axis
- Tick interval: an interval in x direction lasts (10/1 minutes or 10/1/0.1/0.01/0.001 seconds)
- Pixels per tick: use 10/5/2/1 pixels per tick interval
- View as time of day: option to view x direction labels as time of day instead of seconds or minutes since beginning of capture
Y Axis
- Unit: the unit for the y direction (Packets/Tick, Bytes/Tick, Bits/Tick, Advanced…) [XXX - describe the Advanced feature.]
- Scale: the scale for the y unit (Logarithmic,Auto,10,20,50,100,200,500,…)
The button will save the currently displayed portion of the graph as one of various file formats.
The button will copy values from selected graphs to the clipboard in CSV (Comma Separated Values) format.
![[Tip]](wsug_graphics/tip.svg) | Tip |
|---|---|
Click in the graph to select the first package in the selected interval. |