Copyright is held by the author/owner(s).
WWW10, May 1-5, 2001, Hong Kong.
ACM 1-58113-348-0/01/0005.
Note: We strongly recommend printing the PDF version of this paper.
Keywords: Classification, Categorization, Data Mining, Catalog Integration, Web Portals, Web Marketplaces
Imagine you are a marketplace for electronic components. Your catalog features nearly ten million parts categorized into 5000 categories. Noticing your success, a major distributor wants to join your marketplace. This distributor's catalog contains nearly a million parts categorized into 2000 categories. Your problem is how to quickly integrate this distributor's catalog into your catalog.
This problem is pervasive on the web, given many websites are aggregators of information from various sources. B2C shops like Amazon need to integrate catalogs from multiple vendors. B2B portals, Chipcenter and Questlink, each with a large catalog of their own, recently merged to form eChips. Information portals like Yahoo! and Google categorize documents into categories. One can easily conceive a web service that combines the two portals. Many corporate portals are now merging intra-company and external information into a uniform categorization.
This paper presents a new technique to help automate the task of catalog integration. Let us call your marketplace MrCurrent and the distributor who wants to join you MrNew. A straightforward approach to attacking the catalog integration problem would be to formulate it as a classification problem [Mit97]. Take the MrCurrent catalog, treat each category in the catalog as a class, and the information about the products belonging to each category as training examples for the corresponding class. We thus have a well-posed classification problem and a training set and we can build a predictive model for classifying MrNew's products into MrCurrent's categories.
Notice, however, in this straightforward approach, we completely ignored MrNew's categorization. On the other hand, MrNew's categorization contains valuable implicit information about product similarity. Suppose the classifier's prediction is such that 98% of the products belonging to some category in MrNew's catalog fall in one category in MrCurrent's catalog and 2% in a different category. Those 2% predictions are quite possibly errors, but it will also be a mistake to take a winner-takes-all attitude and assume that those 2% are necessarily errors.
Our key contribution is how to incorporate the implicit information contained in MrNew's catalog into the classification process. We show that this additional information can substantially boost classification accuracy.
We now formally define the catalog integration problem we are solving.
A document d is an object consisting of i) a set of words, and/or ii) a set of attribute value pairs. By including attribute value pairs, we are able to cover both text documents as well as product descriptions.
A catalog is a partitioning of a set of documents into a set of categories1. We are given two catalogs:
We optionally identify documents in N that do not fit well in M and give the user the option of adding these as new categories in M.
An assumption underlying our model is that the categorizations used by catalogs M and N are homogenous and have significant overlap. It is possible that the categorizations used by M and N may be completely orthogonal to each other. For instance, consider a corpus of documents describing businesses. The categorization in M is by business type, whereas the categorization in N is by geographical location. In such cases, the implicit information in N will not help us better categorize the documents into M.
Vocabulary changes are a problem for classification in general. For instance, it was observed in [Lar99] that patents about similar inventions can contain very different terminology. If the vocabulary in N is quite different from M, the classification accuracy will certainly be affected. However, this problem is orthogonal to the idea of using the similarity information in N.
Our model flattens the catalog hierarchy and treats it as a set of categories. Past studies [DC00] [CDAR97] have shown that exploiting the hierarchical structure can lead to better classification results than using the flattened structure. Our enhancements for using the information in N can be easily incorporated in a Naive Bayes hierarchical classifier, such as one used in [CDAR97]. Incorporation of these enhancements into other classification schemes, such as the SVM classifier used in [DC00], requires further work.
Another issue related to hierarchies is that the hierarchy in M may be more detailed than N or vice-versa. If M is more detailed than N, our technique can still be helpful. For example, if N has a category ``Cars'', while M has ``Sports Cars'' and ``Sedans'', our technique will not help distinguish between ``Sports Cars'' and ``Sedans''. However, it will help distinguish between these two categories and say ``Trucks''. On the other hand, if N is more detailed than M, the detailed categories in N can be first merged into a super category and our technique can then be applied. (While our technique would be effective even if applied without merging the detailed categories, we show in Section 5.2 that having more documents in the categories in N leads to better results.)
Inducing classification model for a set of categories given examples of objects for each category is a much studied topic in the statistics, machine learning, and data mining literature. See, for instance, [Mit97] for a comprehensive review of various classification techniques. Naive-Bayes classifiers [Goo65] are competitive with other techniques in accuracy [CDAR97] [LR94] [Lan95] [PB97] [MN98]. They are also fast: building the model requires only a single pass over the documents and they quickly classify new documents. Our proposed solution is also Bayesian.
The observation that the classification techniques can be used to assign documents to a hierarchy has been previously made in connection with folder systems. Proposals on the development of classification models for the purpose of routing e-mail include [ABS00] [Coh96] [SDHH98] [SK99]. Other systems provide agents that assist e-mail users by predicting an action the user is likely to take [Mae94] [PE97]. SONIA [SYB98] uses agglomerative text clustering to organize the results of queries to networked information sources, and Naive Bayes classification to organize new documents within an existing categorization scheme. Text classification has also been applied in other domains, e.g. [DPBA99] showed how well SEC (Security Exchange Commission) filings can be classified into SIC categories. None of these systems address the task of merging hierarchies.
The Athena system [ABS00] includes the facility of reorganizing a folder hierarchy into a new hierarchy. The user provides examples of documents for every node of the new hierarchy, which is used as the training set for learning the classification model for new hierarchy. The documents from old hierarchy are then routed to the new hierarchy using this model. But no information from the old hierarchy is used in either building the model or routing the documents.
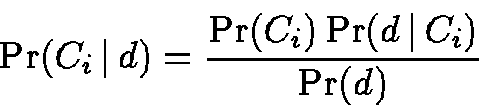
We start with a quick review of Naive Bayes classification and then give the basic algorithm that applies this technique for merging catalogs in a straightforward manner.
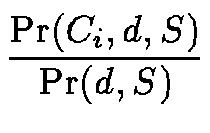
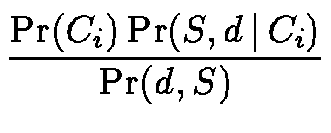
The Naive Bayes classifier estimates the posterior probability of
category Ci given a document d via Bayes' rule
[Mit97]:
We treat
![]() as an input in our enhanced algorithm.
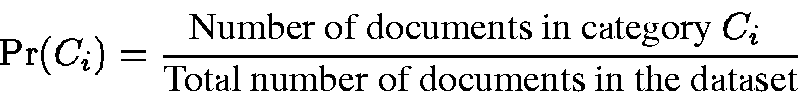
We review here how to compute
as an input in our enhanced algorithm.
We review here how to compute
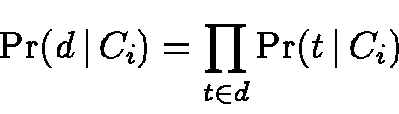
![]() only for the case of text, and refer readers to
[Mit97] for extensions to
the case when the document also contains a set of
attribute-value pairs.2
only for the case of text, and refer readers to
[Mit97] for extensions to
the case when the document also contains a set of
attribute-value pairs.2
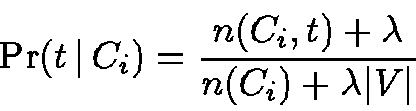
To estimate the first term on the right hand side of Eq. 3,
assume that the words in d are independent of each other. We get
Figure 1 presents the basic method that uses the standard Naive Bayes technique. We first build a classification model using the set of documents already in M. This classification model is then used to place documents from N into M.
1. For each category Ci in M, computeand
(Eqs. 2 and 4, respectively). 2. For each category S in N: For each document d in S: (a) Compute
for each category Ci in M using the statistics computed in Step 1 (Eqs. 1 and 3). (b) Assign d to the category with the highest value for
Note that depending on policy parameters:
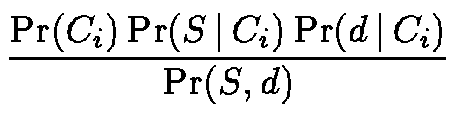
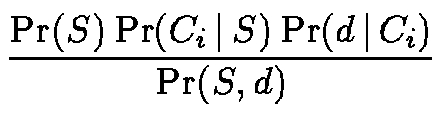
Our proposed method uses the similarity information implicit in the categorization of documents in N to build more accurate classification models. The intuition is that if two documents belong to the same category in N, they are more likely to belong to the same category in M.
Let S denote a category in N. We can extend Bayes rule
from Eq. 1 to incorporate the implicit information in
S. We will use the standard notation ![]() to refer to
to refer to
![]() .
We also use
.
We also use ![]() to refer to
to refer to
![]() ,
and
,
and
![]() to refer to
to refer to
![]() .
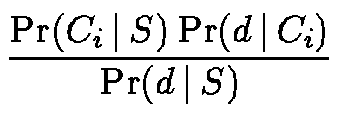
The posterior probability
of category Ci
in M given a document d belonging to category S in N is computed as:
.
The posterior probability
of category Ci
in M given a document d belonging to category S in N is computed as:
To estimate
![]() ,
we first classify the documents using
the basic algorithm, then use the categories of the
documents in S to compute the estimate. A simple estimate could be:
,
we first classify the documents using
the basic algorithm, then use the categories of the
documents in S to compute the estimate. A simple estimate could be:
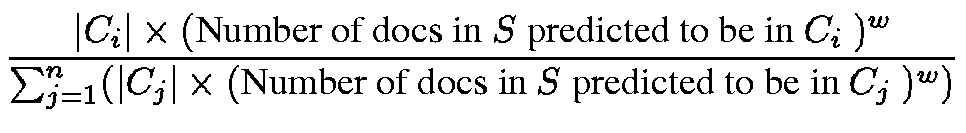
As an illustration, consider a scenario where we know that the source
catalog categories are identical to the master catalog categories.
With a perfect classifier, the above estimate will be 1 for the true
category and 0 for all other categories. With a classifier that is 90%
accurate, the estimate will be .9 for the true category, and perhaps .1/kfor k other categories assuming the errors are evenly split among
them. In this case, we would like
![]() to be 1 for
the category with the most number of documents, and 0 for the other
categories, i.e., use the majority rule. More generally, we can use an
index
to be 1 for
the category with the most number of documents, and 0 for the other
categories, i.e., use the majority rule. More generally, we can use an
index ![]() that reflects the similarity between the
categorization of the two catalogs to decide the amount of weight to
give to the implicit information. We would also like to smooth our
estimate using the statistics for
that reflects the similarity between the
categorization of the two catalogs to decide the amount of weight to
give to the implicit information. We would also like to smooth our
estimate using the statistics for ![]() from M, and
have the property that for w = 0, our enhanced classifier defaults to
the standard classifier. A formula that satisfies these goals is:
from M, and
have the property that for w = 0, our enhanced classifier defaults to
the standard classifier. A formula that satisfies these goals is:
Figure 2 describes the enhanced algorithm, for a given weight w.
1. For each category Ci in M, compute. (c) Re-classify each document in S using
(Eq. 5).
Before describing the method for selecting weight w, we first motivate the need for selecting a good value for w.
Example Consider a master catalog M in which there are separate categories for ``Digital Cameras'' and ``Computer Peripherals''. When we integrate products from the source catalog N, let the basic algorithm come up with the following probabilities for the five products in one of the categories in N.
Based on these probabilities, four out of the five products belong to Camera and one to Peripherals. In the master catalog, let there be 10 products each of these two categories, and none in any other category (to simplify the example). With a weight of 1,
Peripherals Camera P1 .1 .9 P2 .2 .8 P3 .2 .8 P4 .2 .8 P5 .9 .1
With a weight of 2,
Peripherals Camera P1 .03 .97 P2 .06 .94 P3 .06 .94 P4 .06 .94 P5 .69 .31
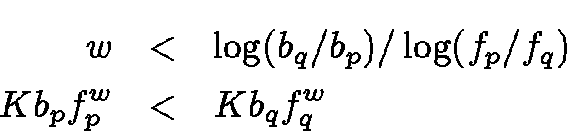
Thus the classification of P5 does not change with a weight of 1, but switches to the majority category with a weight of 2.
Peripherals Camera P1 .01 .99 P2 .02 .98 P3 .02 .98 P4 .02 .98 P5 .36 .64
To determine a good value for the weight, we need a tune set of documents in N for which we know the correct categorization with respect to M. If there are some common documents between M and N, we can use these common documents as the tune set. If there are no common documents between the two catalogs, the creation of the tune set requires user interaction. We select a random subset of the documents in N, and present these to the user to get their categorization in M.
We first make one pass through step 2(a) in
Figure 2 for all the documents in N, allowing
us to compute
![]() for a given weight w. Next,
for each document in the tune set, for a set of values for w, we go
through steps 2(b) and 2(c) in Figure 2 and
determine the values of w for which the document is correctly classified. We
typically use an exponentially increasing series for the set of possible
values of w, e.g. (0, 1, 3, 10, 30, 100, 300, 1000). We then select the
weight that gives the highest accuracy on the documents in the tune set.
If a set of
weights give the same accuracy, we break the tie by choosing the
smallest weight, and thus not
overweight the similarity implied by the hierarchy N.
for a given weight w. Next,
for each document in the tune set, for a set of values for w, we go
through steps 2(b) and 2(c) in Figure 2 and
determine the values of w for which the document is correctly classified. We
typically use an exponentially increasing series for the set of possible
values of w, e.g. (0, 1, 3, 10, 30, 100, 300, 1000). We then select the
weight that gives the highest accuracy on the documents in the tune set.
If a set of
weights give the same accuracy, we break the tie by choosing the
smallest weight, and thus not
overweight the similarity implied by the hierarchy N.
We can reduce the number of documents the user has to inspect by making two passes. After selecting a random subset of documents in N, we make a first pass through Step 2 for those documents, and discard those which have the same categorization for all the weights. Since the categorization does not change, knowing the true category for these documents will not help us choose the weight. We then present the remaining documents to the user, and choose the weight that gives the highest accuracy on these documents. We empirically found in Section 5.2 that by following this strategy, feedback from the user on just 5 to 10 documents was sufficient to get a near-optimal value for the weight.
Depending on the cost of getting a tune set and the size of the catalog, we either choose a global weight for the entire catalog, or tune weights differently for different sections of the catalog.
We first study the behavior of the enhanced algorithm with respect to weight w. We then show that with a good choice for the value of w, the enhanced algorithm will do no worse, and can do substantially better than the basic algorithm.
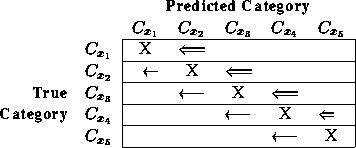
Consider the documents belonging to a category S in N.
Our first theorem shows that as we increase the weight w, the
predicted category of a document in S will either stay the same or
switch from a less frequent
category to a more frequent category, where frequency of a category is
the number of documents in S predicted to be in that category. Denote
Let
![]() represent the categories ordered
by their frequency in the predicted categories of the documents in S,
i.e.,
represent the categories ordered
by their frequency in the predicted categories of the documents in S,
i.e.,
![]() ,
Figure 3 shows the movement of documents with increasing
weight.
We can split the documents into three classes:
,
Figure 3 shows the movement of documents with increasing
weight.
We can split the documents into three classes:
The catch is that the optimum value of the weight for which the enhanced algorithm achieves highest accuracy is data dependent. The method using a tune set described in the previous section attempts to select a good value for the weight, but there is no guarantee of success. Our experimental results in the next section show that we were able to get substantial accuracy improvements using this method.
We present experimental results using two types of datasets:
Synthetic Catalogs Start with a real-world catalog and consider it to be the master catalog M. Derive source catalogs N from M using various distributions. Consider a specific category Cm in M. Some of the documents from Cmare assigned to the corresponding category in N, while some are spread over other categories. Use a distribution to determine how many documents are distributed over how many categories. For example, a simple 80-20 distribution will send 80% of the documents to the corresponding category and 20% to some other category. Different distributions result in different degrees of overlap between M and N. We use a variety ranging from a ``perfect'' match between the two catalogs, to a ``Gaussian'' distribution where there is only a moderate amount of similarity. We generate synthetic catalogs from three master catalogs: a collection of news articles from Reuters, the Pangea electronics part descriptions dataset, and a slice of the Google hierarchy.
Now consider a specific document d from Cm in M that the synthetic data generation assigns to the category Sn in N. While integrating N into M, if d is assigned a category other than Cm, we count it as a classification error; otherwise the assignment is correct.
Real Catalogs Start with two real-world catalogs that have some common documents. Treat the first catalog minus the common documents as the master catalog M. Remove from the second catalog all documents except the common ones. Treat the remaining documents in the second catalog as the source catalog N. We thus know for each document in N the correct classification in M. The goal for the catalog integration algorithm now is to successfully predict for each document in N its correct category in M. We do these experiments using Google and Yahoo! categories.
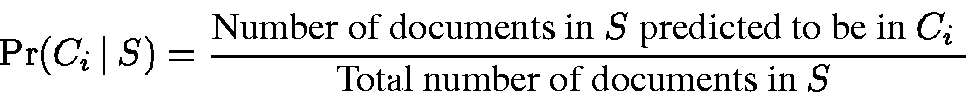
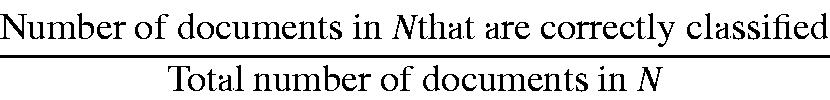
Experiments Our goal is to understand the following performance characteristics:
We use the classification
accuracy as the metric for measuring the success of our approach.
Accuracy is defined as
In the rest of this section, we describe in detail the datasets and the experimental results. Section 5.1 discusses the synthetic datasets and Section 5.2 the results with these datasets. Section 5.3 discusses the real datasets, and Section 5.4 reports results with these datasets.
Master Catalogs We used the following master catalogs for generating synthetic catalogs:
Figure 4 shows the number of categories and total number of documents for these catalogs.
| Dataset | Categories | Docs |
| Reuters | 82 | 11,367 |
| Pangea | 1148 | 37,012 |
| Google.Outdoors | 38 | 7,431 |
Target Distributions for Synthetic Catalogs
Our synthetic catalogs have as many categories as the master catalog. We spread documents from a certain category in the master catalog to multiple categories in the synthetic catalog. Figure 5 shows the various target distributions we used for spreading documents. For the Perfect distribution, each category in the synthetic catalog will have documents from a single category in the master catalog. On the other hand, for GaussianB distribution, documents from a category in the master catalog will be spread over 7 categories in the synthetic catalog, and each category in the synthetic catalog will include documents from 7 categories in the master catalog. The intent was to evaluate the performance of our approach to catalog merging over a wide range of similarity characteristics between the categorizations of the two catalogs.
| Name | Distribution |
| Perfect | 100 |
| 90-10 | 90, 10 |
| 80-20 | 80, 20 |
| GaussianA | 68.2, 27.2, 4.3, 0.3 |
| GaussianB | 38.3, 29.9, 18.4, 8.8, 3.4, 0.9, 0.3 |
Figure 6 gives the details of the algorithm for generating N.
// n: number of categories in M //: cumulative frequency distribution // f0 := 0 (to simplify the description) for i := 1 to n begin foreach document d in Ci begin Let r := uniformly distributed random number in [0, 1). Find p such that
. j :=
; Assign d to category Sj. end end
| Distribution | Reuters | Pangea | |
| Perfect | 100 | 100 | 100 |
| 90-10 | 91.2, 8.8 | 90.6, 9.4 | 91.1, 8.9 |
| 80-20 | 82.0, 18.0 | 80.9, 19.1 | 82.6, 17.4 |
| GaussianA | 70.8, 25.5, 3.5, 0.2 | 69.2, 27.1, 3.5, 0.1 | 68.5, 28.0, 3.4, 0.1 |
| GaussianB | 51.2, 27.5, 11.8, 6.5, 2.1, 0.9 | 45.2, 28.4, 15.8, 8.1, 2.2, 0.3 | 42.2, 28.8, 18.9, 7.2, 2.5, 0.3 |
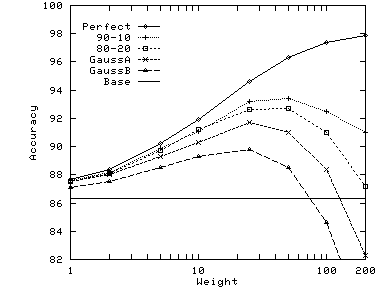
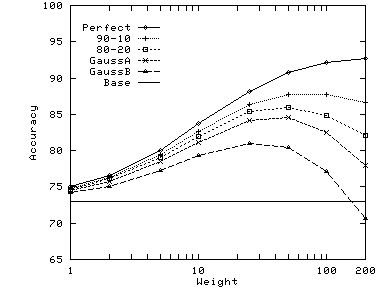
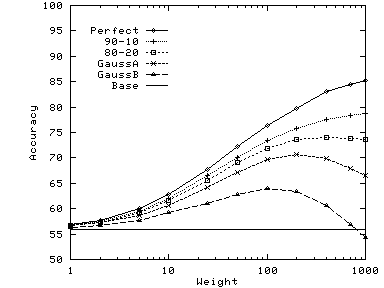
In general, the optimal value of weight increases with increasing
similarity between the two hierarchies. The other factor is the size of
the documents in the dataset: as documents become longer, the
differences between
![]() for different categories becomes
larger
and hence a higher weight is
needed to influence the results. The documents from the Google dataset
are significantly longer than those from Reuters or Pangea; hence for
the same distribution of the synthetic hierarchy, the optimal weight is
higher for Google.
for different categories becomes
larger
and hence a higher weight is
needed to influence the results. The documents from the Google dataset
are significantly longer than those from Reuters or Pangea; hence for
the same distribution of the synthetic hierarchy, the optimal weight is
higher for Google.
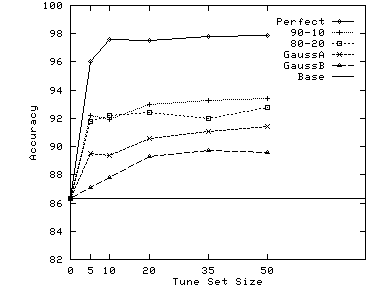
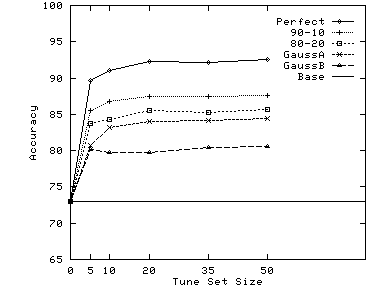
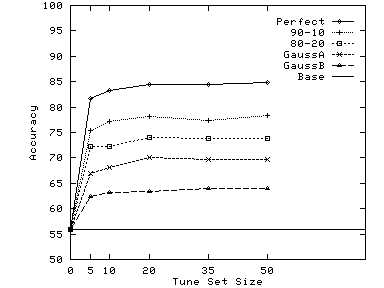
Figure 9 shows that very small tune sets are sufficient to choose the right weight. With just 5 carefully chosen examples, we are able to do almost as well as with 10 to 50 examples: there are only slight improvements beyond 10 examples. The reason why so few examples are sufficient is that changes in weights only change the classification of a small fraction (typically around 10%) of the total documents to be classified. By choosing only such documents to present for tuning, we get the same effect as we would by presenting 10 times as many random documents.
| (a) Reuters |
 |
| (b) Pangea |
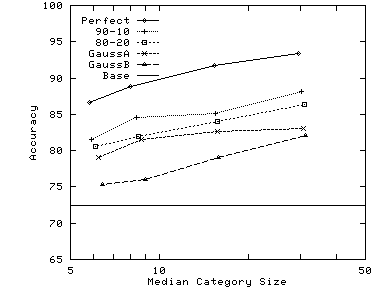 |
| (c) Google.Outdoors |
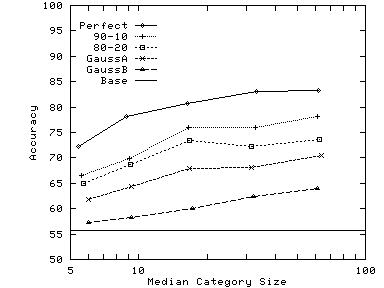 |
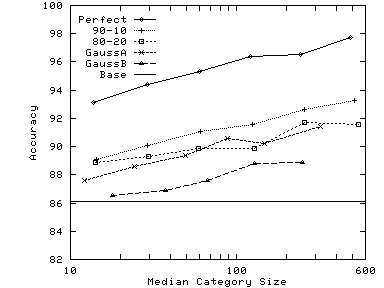
To evaluate our approach using real catalogs for N, we wrapped the Google and Yahoo! websites, extracted over 100,000 links from 5 different sections of their categorizations, and retrieved the corresponding web pages.3 Incidently, we found less than 10% overlap between the links in Google and Yahoo!. Figure 11(a) shows the number of categories, number of links obtained from the website, and number of documents (after dropping the common documents and those documents our crawler could not get). When computing the set of common links, we ignored links that had multiple categories. Figure 11(b) shows similar numbers for the set of common documents. We include both the weighted median and the average documents per category, since the median can sometimes be much higher. This figure also shows the distributions of the categories. For instance, a single category in Google.Autos had, on average, 78% of documents from a single category in Yahoo.Autos, 9% from a second category in Yahoo.Autos, 5% from a third category, and so on. These distributions look similar to the Gaussian distributions we used in the synthetic catalogs, except that the tails are longer.
| (a) All Documents | (b) Common Documents | |||||||
| Docs/Category | ||||||||
| Dataset | Categories | Links | Docs | Categories | Docs | Average | Median | Distribution |
| Google.Autos | 26 | 8095 | 7351 | 23 | 223 | 9.7 | 52 | 78, 9, 5, 4, 3, 1, .4 |
| Yahoo.Autos | 59 | 7202 | 6021 | 36 | 223 | 6.2 | 49 | 76, 13, 5, 2, 1, .9, .9, .4, .2, .2 |
| Google.Movies | 40 | 7285 | 6483 | 32 | 130 | 4.1 | 8 | 69, 15, 6, 3, 3, 1, 1, .7, .7, .7 |
| Yahoo.Movies | 45 | 8531 | 7433 | 38 | 130 | 3.4 | 7 | 64, 20, 8, 4, 2, 1, .6, .2 |
| Google.Outdoors | 38 | 7707 | 7260 | 30 | 135 | 4.5 | 6 | 76, 16, 6, 1 |
| Yahoo.Outdoors | 68 | 8756 | 8162 | 37 | 135 | 3.6 | 7 | 80, 11, 3, 2, 1, .7, .7, .5, .2, .2 |
| Google.Photography | 26 | 3661 | 3233 | 22 | 148 | 6.7 | 15 | 67, 18, 6, 4, 2, 2, 2, .5 |
| Yahoo.Photography | 35 | 3575 | 3014 | 26 | 148 | 5.7 | 11 | 59, 17, 9, 5, 3, 2, 2, .9, .4, .4 |
| Google.Software | 77 | 20471 | 18864 | 55 | 189 | 3.4 | 8 | 69, 15, 7, 4, 3, .9, .3, .3, .3, .3 |
| Yahoo.Software | 46 | 12222 | 10673 | 37 | 189 | 5.1 | 7 | 50, 14, 8, 6, 4, 3, 2, 1, .9, .9 |
Figure 12 shows the performance of the algorithm on the 10 datasets given in Figure 11. We tested the accuracy of the classifiers when merging the Yahoo! categorization into the corresponding Google categorization and vice versa. The enhanced algorithm did very well even though the two catalogs were quite different: 30% fewer errors on average (14.1% difference in absolute accuracy) when classifying Yahoo! into Google, and 26% fewer errors on average (14.3% difference in absolute accuracy) when classifying Google into Yahoo!.
| Accuracy | Improvement | |||
| Dataset | Basic | Enhanced | Absolute | Relative |
| Autos | 60.5 | 76.2 | 15.7 | 40% |
| Movies | 27.1 | 42.6 | 15.5 | 21% |
| Outdoors | 65.2 | 77.8 | 12.6 | 36% |
| Photography | 50.7 | 62.8 | 12.1 | 25% |
| Software | 47.6 | 62.4 | 14.8 | 28% |
| Average | 50.2 | 64.4 | 14.1 | 30% |
| Accuracy | Improvement | |||
| Dataset | Basic | Enhanced | Absolute | Relative |
| Autos | 50.2 | 73.1 | 22.9 | 46% |
| Movies | 28.5 | 46.2 | 17.7 | 25% |
| Outdoors | 55.9 | 65.4 | 9.5 | 22% |
| Photography | 45.4 | 51.3 | 5.9 | 11% |
| Software | 43.0 | 58.6 | 15.6 | 27% |
| Average | 44.6 | 58.9 | 14.3 | 26% |
We presented a technique for integrating documents from a source catalog into a master catalog that takes advantage of the implicit information present in the source catalog: that documents in the same category in the source catalog are similar. Our technique enhances the standard Naive Bayes classification by incorporating this information when classifying source documents. We showed through analysis that the highest accuracy achievable with our enhanced technique can be no worse than what can be achieved with the standard Naive Bayes classification.
Our experiments using synthetic as well as real data indicate that the proposed technique can result in large accuracy improvements. Using a tune set for selecting the weight to give the implicit information allows our enhanced algorithm to do substantially better, and never do significantly worse. Our experiments also showed that the size of the tune set can be very small and hence not place a significant burden on the user of the system.
A. Proofs
Consider the documents belonging to a category S in N. Let
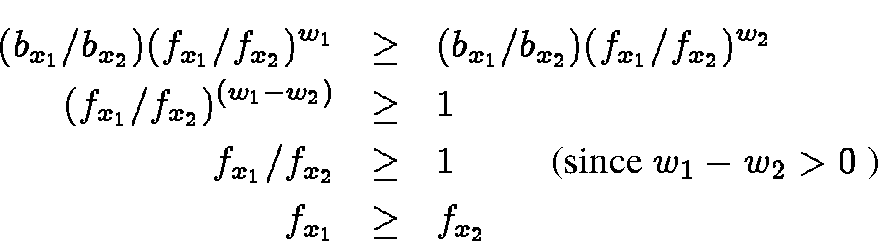
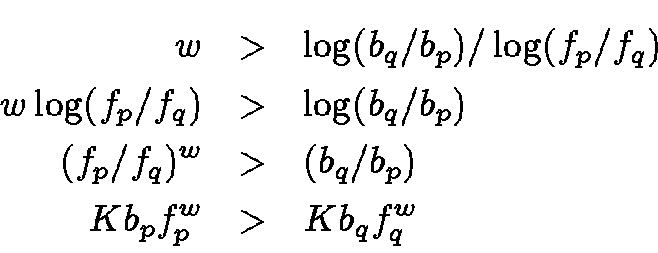
Proof: Let Cp be the correct classification for document d. We split all other categories into five groups: