We introduce five methods for summarizing parts of Web pages on handheld devices, such as personal digital assistants (PDAs), or cellular phones. Each Web page is broken into text units that can each be hidden, partially displayed, made fully visible, or summarized. The methods accomplish summarization by different means. One method extracts significant keywords from the text units, another attempts to find each text unit's most significant sentence to act as a summary for the unit. We use information retrieval techniques, which we adapt to the World-Wide Web context. We tested the relative performance of our five methods by asking human subjects to accomplish single-page information search tasks using each method. We found that the combination of keywords and single-sentence summaries provides significant improvements in access times and number of pen actions, as compared to other schemes.
Wireless access to the World-Wide Web from handheld personal digital assistants (PDAs) is an exciting, promising addition to our use of the Web. Much of our information need is generated on the road, while shopping in stores, or in conversation. Frequently, we know that the information we need is online, but we cannot access it, because we are not near our desk, or do not wish to interrupt the flow of conversation and events around us. PDAs are, in principle, a perfect medium for filling such information needs right when they arise.
Unfortunately, PDA access to the Web continues to pose difficulties for users [14]. The small screen quickly renders Web pages confusing and cumbersome to peruse. Entering information by pen, while routinely accomplished by PDA users, is nevertheless time consuming and error-prone. The download time for Web material to radio linked devices is still much slower than landline connections. The standard browsing process of downloading entire pages just to find the links to pursue next is thus poor for the context of wireless PDAs.
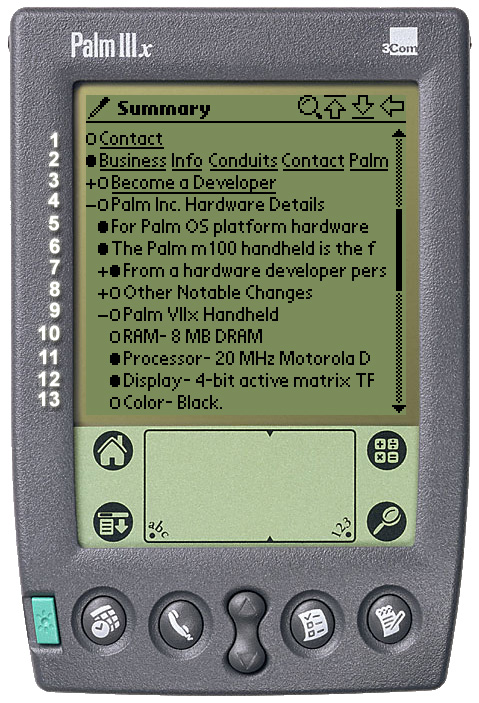
We have been exploring solutions to these problems in the context of our Power Browser Project [3, 4]. The Power Browser provides displays and tools that facilitate Web navigation, searching, and browsing from a small device. In this paper we focus exclusively on a new page browsing facility that is described in [5]. This facility is employed after a user has searched and navigated the Web, and wishes to explore in more detail a particular page. At this point, the user needs to gain an overview of the page, and needs the ability to explore successive portions of the page in more depth. Figure 1 shows a screen shot of the interface described in [5].
We arrive at the page summary display of Figure 1 by partitioning an original Web page into 'Semantic Textual Units' (STUs). In summary, STUs are page fragments such as paragraphs, lists, or ALT tags that describe images. We use font and other structural information to identify a hierarchy of STUs. For example, the elements within a list are considered STUs nested within a list STU. Similarly, elements in a table, or frames on a page, are nested. Note that the partitioning of Web pages and organization into a hierarchy is deduced automatically and dynamically (by a proxy). The Web pages do not need to be modified in any way, which is a significant advantage of our approach over schemes that rely on pages specially structured for PDAs. (Please see [5] for details on how STUs are extracted from pages, and how they are ordered into a hierarchy.)
Initially, only the top level of the STU hierarchy is shown on the screen. In Figure 1 this top level consists of four STUs in lines 1-4. (When this page is initially visited, lines 5-13 are blank. Incidentally, the line numbers are only for convenience here and do not appear on the display.) Each STU is initially "truncated" and displayed in a single line.
Users may use left-to-right pen gestures or the '+/-' nesting controls to open the hierarchy, as shown in lines 5-13. The lower-level STUs are shown indented. For example, the STU of line 4 has been expanded, revealing lines 5-9. Then the STU of line 9 was expanded to reveal lines 10-13. The STU of line 3 has not been expanded, and hence the '+' on that line.
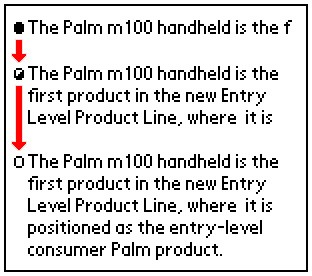
As mentioned above, initially STUs are displayed on a single line. In fact, in Figure 1 we only see the first portion of each STU's first sentence. If an STU contains more text, a 'line marker' (black bubble) indicates that more information is available. For example, the STU of line 6 only shows the text "The Palm m100 handheld is the f". The user can progressively open the STU by tapping on the bubble marker (see Figure 2). In particular, after the first tap, the first three lines of the STU are shown. A half-empty line marker signals that text is still available. A second tap reveals all of the STU. In this case, an empty line maker indicates that the entire STU is revealed. The system thus reveals each STU in up to three display states (two if the STU was smaller than or equal to three lines, or one state if the entire STU fits on a single line).
Note that this scheme reorganizes the Web page at two levels. The first is a structural level, which users control by opening and closing the STU hierarchy as they tap on the '+/-' characters on the screen. The second level is the successive disclosure of individual STUs that is controlled through the line markers. Thus, a STU like the one in line 7 of Figure 1 can be "opened" in two ways: tapping the bubble reveals its textual content (e.g., text in a paragraph), while tapping on its '+' reveals nested STUs (e.g., list items under this paragraph).
Using this two-level, 'accordion' approach to Web browsing, users can initially get a good high-level overview of a Web page, and then "zoom into" the portions that are most relevant. Indeed, the results of our user studies in [5] indicate that users respond well to this scheme and can complete browsing tasks faster than with conventional browsers that attempt to render a page as it would be seen on a full display.
This scheme relies on users being able to determine which is a good STU to "drill into" simply by reading a one line "summary" of the STU. If the first line of the first sentence is not descriptive, then users may be mislead. Since this summarization is the key aspect for effective browsing on small devices, in this paper we carefully develop and evaluate other options for summarizing STUs.
In particular, we develop summarization schemes that select important keywords, and/or that select the most descriptive sentence within a STU. We also consider the question of what to disclose after the initial keywords or key sentence. If a user wants more detail, should we disclose more keywords or more key sentences? Or at some point should we revert to progressively showing the text from its beginning? We compare our summarization techniques through user experiments, and show that browsing times can be significantly reduced by showing good summaries.
Our work builds on well known techniques for text summarization [17]. However, there are important practical differences between the traditional task of summarizing a document, and our problem of summarizing Web pages. In particular, traditional summarization is not progressive. A document is summarized, and the user decides whether to read the full document. Since many Web pages have very diverse content (as an extreme case, think of summarizing the Yahoo! home page), it does not make sense to summarize the entire page as one unit. Rather, we believe it is best to partition the page, and attempt to summarize the parts. However, partitioning means that we have less text to work with as we summarize, so it may be harder to determine what sentences or keywords are more significant. In this paper we study how traditional summarization techniques can be used in concert with progressive disclosure, and how to tune summarization parameters to deal with small portions of text.
There is also the issue of hyperlinks, which does not arise in traditional summarization. That is, should hyperlinks be shown and be active in the summaries? What if a hyperlink starts in one of the lines displayed in a summary, but continues on to other lines? Should the fact that a sentence has a hyperlink be weighted in deciding if the sentence is "important"? We briefly discuss some of these questions in this paper.
Another difference with traditional schemes is the computation of collection statistics. Many summarization techniques (including ours) need to compute how frequently a word (term) occurs in the document collection, or how many documents in the collection have a given word. In our case, the Web is our collection, but it is very hard to collect statistics over the entire Web. And even if we could, the table of term frequencies would be too large to hold in main memory for efficient summarization. Thus, we are forced to "approximate" the collection statistics, as will be described in this paper.
We have focused on five methods for displaying STUs, and performed user testing to learn how effective each of them are in helping users solve information tasks on PDAs quickly. All of the methods we tested retain our accordion browser approach of opening and closing large structural sections of a Web page. But the methods differ in how they summarize and progressively reveal the STUs.
Every method we tested displays each STU in several states, just as our previous accordion browser did. But the information for each state is prepared quite differently in each method. All displays are textual. That is, none of the STU displays images. (There has been work on image compression for PDA browsers [11], but these techniques have not yet been incorporated into our browser.) The methods we tested are illustrated in Figure 3. They work as follows:
There are, of course, many other ways to mix keywords, summary sentences, and progressive disclosure. However, in our initial experience, these 5 schemes seemed the most promising, and hence we selected them for our experiments. Also note that in all of these methods, only one state is used if an entire STU happens to fit on a single line. Similarly, if an STU consists of only one sentence, the most significant sentence is the entire STU and there are no additional state transitions.
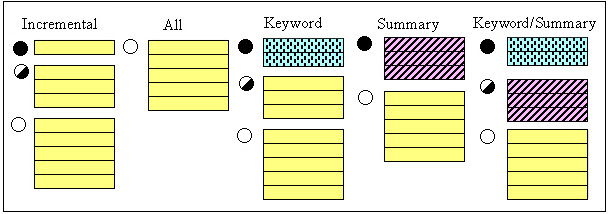
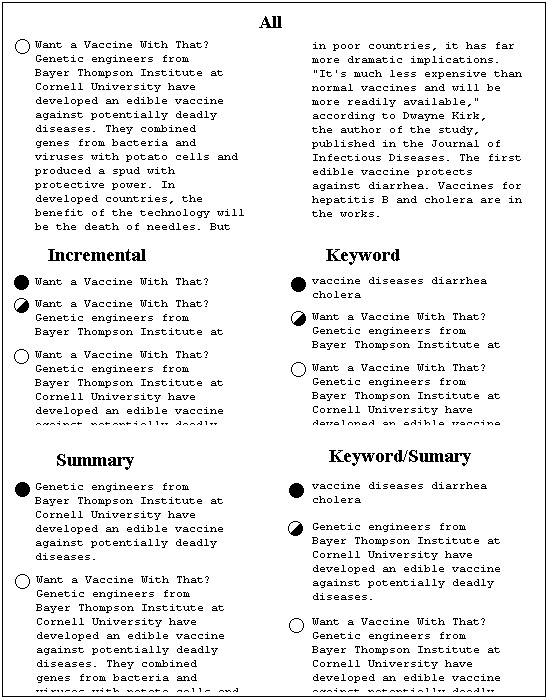
Figure 4 shows an example that applies all five methods to one STU on www.onhealth.com. The ALL method at the top of Figure 4 is shown in two columns for reasons of presentation in this publication only. On PDAs and cellular phones, the display is arranged as a single column. The ALL method displays all of the STU's text. The empty line marker on the left indicates to the user that the STU cannot be expanded further.
Output of the Incremental method, while truncated at the bottom for display purposes here, would continue down the PDA screen to the end of the STU. This method, again, shows one line, then three lines, and finally the entire STU. The line markers indicate how much information is left hidden in each disclosure state. The Keyword method has extracted keywords "vaccine", "diseases", "diarrhea", and "cholera" from the full STU. For the method's second disclosure state we recognize the first three lines of the STU. The third state is, as always, the full STU. The Summary method has extracted the second sentence from the STU as a summary. This method's second state is the entire STU. The Summary/Keyword method, finally, combines keywords and summary.
All of our states, except Keywords, display hyperlinks when encountered. For example, if a summary sentence contains a link, it is displayed and is active. (If the user clicks it, the top-level view of the new page is shown.) In the Incremental method, if the link starts at the end of a truncated line, the visible portion of the link is shown and is active. (Since the whole link is not seen, the user may not know what the link is.) With Keywords summarization, no links are displayed, even if a keyword is part of some anchor text. In this case we felt that a single keyword was probably insufficient to describe the link. Furthermore, making a keyword a link would be ambiguous when the new keyword appears in two separate links.
Stepping back, Figure 5 shows how users' requests for Web pages are processed, and how summarized pages are generated. The components of Figure 5 are located in a Web proxy through which Web page requests from PDAs are filtered. We will provide detailed explanations for the dark gray components in subsequent sections. The User Manager keeps track of PDA user preferences (e.g., preferred summarization method, timeout for downloading Web pages), and of information that has already been transmitted to each active user's PDA. This record keeping activity is needed, because the proxy acts as a cache for its client PDAs. Once a requested Web page, possibly with associated style sheet, has been downloaded into the proxy, a Page Parser extracts all the page tokens. Using these tokens, the Partition Manager identifies the STUs on the page, and passes them to the Organization Manager, which arranges the STUs into a hierarchy. In Figure 1, the results of the Organization Manager's work are the entries that are preceded by the '+' and '-' characters.
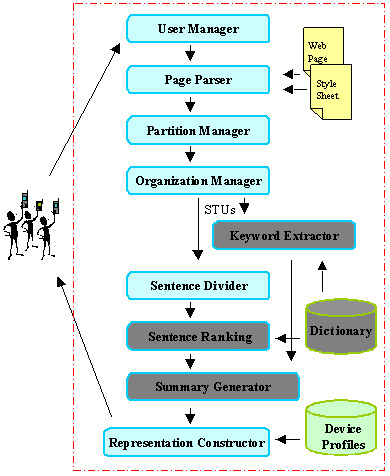
The Summary Generator (second module up from the bottom of Figure 5) operates differently for our five STU display methods. For the Incremental and ALL methods, this module passes STUs straight to the Representation Manager for final display. For the Keyword and Keyword/Summary methods, the Summary Generator relies on the Keyword Extractor module. This module uses a dictionary that associates words on the Web with word weights that indicate each word's importance. The module scans the words in each STU and chooses the highest-weight words as keywords for the STU. These keywords are passed to the Summary Generator.
For the Summary and Keyword/Summary methods, the Summary Generator relies on the Sentence Divider and the Sentence Ranking modules. The Sentence Divider partitions each STU into sentences. This process is not always trivial [19, 20, 23]. For example, it is not sufficient to look for periods to detect the end of a sentence, as abbreviations, such as "e.g." must be considered. The Sentence Ranking module uses word weight information from the dictionary to determine which STU sentence is the most important to display.
The Representation Constructor, finally, constructs all the strings for the final PDA display, and sends them to the remote PDA over a wireless link. The Representation Constructor draws target device information from the Device Profiles database (e.g., how many lines in the display, how many characters per line). This database allows the single Representation Constructor to compose displays for palm sized devices and for cellular phones. The respective device profiles contain all the necessary screen parameters.
We now go into more detail on how the summarization process works. Again, this process involves the dark gray modules in Figure 5. This process includes summary sentence and keyword extraction.
The Incremental and ALL STU display states are easy to generate, because they do not require any text analysis. The remaining three methods require the extraction of significant keywords, and the selection of a 'most significant' sentence from each STU. We use the well-known TF/IDF and within-sentence clustering techniques to find keywords and summary sentences. However, these techniques have traditionally been used on relatively homogeneous, limited collections, such as newspaper articles. We found that the Web environment required some tuning and adaptation of the algorithms. We begin with a discussion of our keyword extraction.
Keyword extraction from a body of text relies on an evaluation of each word's importance. The importance of a word W is dependent on how often W occurs within the body of text, and how often the word occurs within a larger collection that the text is a part of. Intuitively, a word within a given text is considered most important if it occurs frequently within the text, but infrequently in the larger collection. This intuition is captured in the TF/IDF measure [24] as follows:

Parameter n in this formula requires knowledge of all words within the collection that holds the text material of interest. In our case, this collection is the World-Wide Web, and the documents are Web pages.
Given the size of the Web, it is impossible (at least for us) to construct a dictionary that tells us how frequently each word occurs across Web pages. Thus, the system of Figure 5 uses an approximate dictionary that contains only some of the words, and for those only contains approximate statistics. As we will see, our approximation is adequate because we are not trying to carefully rank the importance of many words. Instead, typically we have a few words in an STU (recall that STUs are typically single text paragraphs), and we are trying coarsely to select a handful of important words. Because our dictionary is small, we can keep it in memory, so that we can evaluate keywords and sentences quickly at runtime.
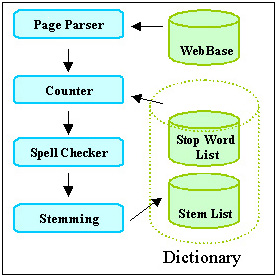
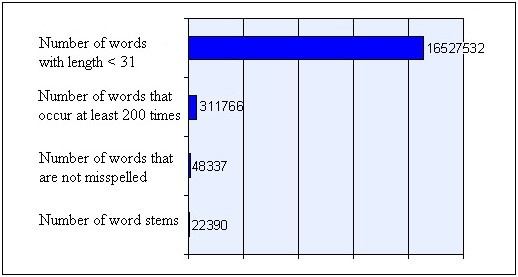
To build our approximate dictionary, we analyzed word frequencies over 20 million Web pages that we had previously crawled and stored in our WebBase [13]. Figure 6 illustrates how the dictionary was created, and Figure 7 shows the number of words in the dictionary after each step. The Page Parser in Figure 6 fetches Web pages from our WebBase and extracts all the words from each page. The Page Parser sends each word to the Counter module, unless the word is a stop word, or is longer than 30 characters. Stop words are very frequent words, such as "is", "with", "for", etc.
The Counter module tags each unique word with a number and keeps track of the number of documents in which the word occurs. The top bar in Figure 7 shows how many words we extracted in this counting procedure.
Once counting is complete, the words that occur less than 200 times across all the pages are eliminated. This step discards 98% of the words (second bar in Figure 7). Notice that this step will remove many person names, or other rare words that may well be very important and would make excellent keywords for STUs. However, as discussed below, we will still be able to roughly approximate the frequency of these missing words, at least as far as our STU keyword selection is concerned.
The remaining words are passed through a spell checker which eliminates another 84% of these remaining words. The size of the dictionary has now shrunk to 48 thousand words (Figure 7).
Finally, words that have the same grammatical stem are combined into single dictionary entries. For example, 'jump' and 'jumped' would share an entry in the dictionary. We use the Porter stemming algorithm for this step of the process [21]. The resulting dictionary, or 'stem list' contains 22,390 words, compared to 16,527,532 of the originally extracted set. The words, and the frequency with which each word occurs in the 20 million pages, are stored in a dictionary lookup table. The frequencies are taken to be approximations for the true number of occurrences of words across the entire Web.
At runtime, when 'significant' keywords must be extracted from an STU, our Keyword Extractor module proceeds as follows. All the words in the STU are stemmed. For each word, the module performs a lookup in the dictionary to discover the approximate frequency with which the word occurs on the Web. The word's frequency within the Web page that contains the STU is found by scanning the page in real time. Finally, the word's TF/IDF weight is computed from these values. Words with a weight beyond some chosen threshold are selected as significant.
A special situation arises when a word is not in the dictionary, either because it was discarded during our dictionary pruning phase, or it was never crawled in the first place. Such words are probably more rare than any of the ones that survived pruning and were included in the dictionary. We therefore ensure that they are considered as important as any of the words we retained. Mathematically, we accomplish this prioritization by multiplying the word's document frequency with the inverse of the smallest collection frequency that is associated with any word in the dictionary. Given that we are only searching for keywords with TF/IDF weight above a threshold, replacing the true small weight by an approximate but still small weight, has little effect. Thus, given this procedure, we can compute the TF/IDF score for all words on any Web page.
Finally, notice that in our implementation we are not yet giving extra weight to terms that are somehow "highlighted." We believe that when a term is in italics, or it is part of an anchor, it is more likely to be a descriptive keyword for an STU. We plan to extend the weight formula given earlier to take into account such highlighting.
Two of our methods, Summary, and Keyword/Summary require the Sentence Ranking module of our system to extract the most important sentence of each STU. In order to make this selection, each sentence in an STU is assigned a significance factor. The sentence with the highest significance factor becomes the summary sentence. The significance factor of a sentence is derived from an analysis of its constituent words. Luhn suggests in [16] that sentences in which the greatest number of frequently occurring distinct words are found in greatest physical proximity to each other, are likely to be important in describing the content of the document in which they occur. Luhn suggests a procedure for ranking such sentences, and we applied a variation of this procedure towards summarization of STUs in Web pages. The procedure's input is one sentence, and the document in which the sentence occurs. The output is an importance weight for the sentence.
The procedure, when applied to sentence S, works as follows. First, we mark all the significant words in S. A word is significant if its TF/IDF weight is higher than a previously chosen weight cutoff W. W is a parameter that must be tuned (see below). Second, we find all 'clusters' in S. A cluster is a sequence of consecutive words in the sentence for which the following is true: (i) the sequence starts and ends with a significant word. And (ii) fewer than D insignificant words must separate any two neighboring significant words within the sequence. D is called the distance cutoff, and is also a parameter that must be tuned. Figure 8 illustrates clustering.
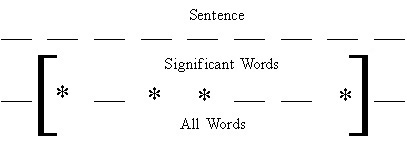
In Figure 8, S consists of nine words. The stars mark the four words whose weight is greater than W. The bracketed portion of S encloses one cluster. The assumption for this cluster is that the distance cutoff D>2: we see that no more than two insignificant words separate any two significant words in the figure. We assume that if Figure 8's sentence were to continue, the portions outside brackets would contain three or more insignificant words.
A sentence may have multiple clusters. After we find all the clusters within S, each cluster's weight is computed. The maximum of these weights is taken as the sentence weight. Luhn [16] computes cluster weight by dividing the square of the number of significant words within the cluster by the total number of words in the cluster. For example the weight of the cluster in Figure 8, would be 4x4/7.
However, when we tried to apply Luhn's formula, we achieved poor results. This was not surprising, since our data set is completely different from what Luhn was working with. Therefore we tried several different functions to compute cluster weight. We achieve the best cluster weighting results by adding the weights of all significant words within a cluster, and dividing this sum by the total number of words within the cluster.
We conducted user tests to help us tune the weight and distance cutoffs for cluster formation and to inform our selection of the above cluster weighting function. Figure 9 shows the steps we took.
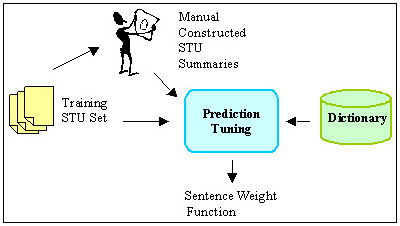
We selected ten three-sentence STUs from Web pages of ten different genres. We asked 40 human subjects to rank these sentences according to the sentences' importance. We then passed the STU set and the results of the human user rankings to a Prediction Tuning Unit. It used the dictionary and these two inputs to find the parameter settings that make the automatic rankings best resemble the human-generated rankings.
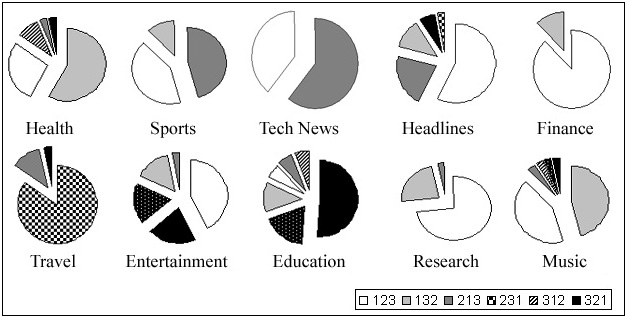
Figure 10 summarizes the results of the human-generated rankings. For example, for the "Sports" STU, about 44% percent of the human subjects said the most descriptive sentence was number 1 (of that STU), and that the second most descriptive sentence was number 2. (Thus, the sentence ranking was 1-2-3.) Another 44% preferred the sentence ordering 2-1-3, while about 12% liked 1-3-2. Clearly, ranking is subjective. For example, subjects disagreed in six ways on the ranking of the three education sentences, although about half of the subjects did settle on a 3-2-1 ranking. Finance clearly produced a 1-2-3 ordering, while the result for technical news is almost evenly split between a 1-2-3, and a 2-1-3 order. In most cases, however, there is a winning order.
These results in hand, the task was to tune the cutoffs and the cluster weighting formula so that automatic ordering would produce rankings that matched the human-generated results as closely as possible. Figure 11 illustrates this optimization problem. The two axis represent the parameters, distance and weight cutoff. The lightness of each area is proportional to how many of the most-popular rankings (or second most popular rankings) are selected at that setting. For instance, with a weight cutoff of 2 and a distance cutoff of 3, we get a very dark area, meaning that with these parameter values almost none of the two most-popular human rankings are selected.
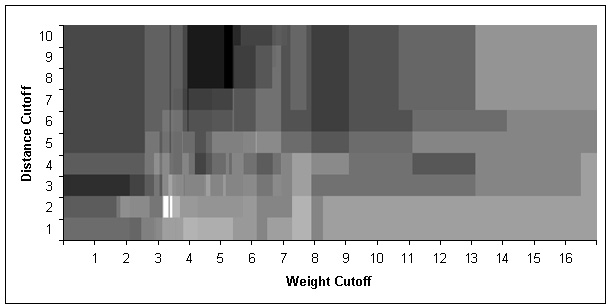
The brightest region in Figure 11 has the optimum cutoff values, 2 for the distance cutoff and 3.16 for the weight cutoff. These are the values used by our system. With these values, the automatic ranking agreed with the most preferred human-generated ranking 70% of the time, and with the second-most preferred ranking 20% of the time.
Armed with a tuned test system, we designed user experiments that would reveal which of the five methods of Figure 3 worked best for users. In particular, we wanted to determine which method would allow users to complete a set of sample information exploration tasks fastest, and how much I/O (pen gestures) users needed to perform for each method.
We constructed an instrumented Palm Pilot and Nokia cellular phone emulator and added it as a user front-end to the test system described in Figure 5. The emulator does not simulate a complete Palm Pilot or cellular phone in the sense that it could run programs written for these devices. It rather performs only the functions of our browser application. The emulator does maintain a live connection to our Web proxy, which, in turn, communicates with the Web. If users were to follow links on the emulator display (which they did not for this set of experiments), then the emulator would request the page from the proxy and would display the result. We can toggle the display between the Palm Pilot and the cellular phone look-alike, so that we can assess the impact of the cellular phone's smaller screen. We have not performed the cellular phone experiments yet.
The emulator displays a photo-realistic image of a 3COM Palm Pilot or Nokia phone on a desktop screen. Instead of using a pen, users perform selection operations with the mouse. We consider this substitution acceptable in this case, because our experiments required no pen swiping gestures. Only simple selection was required. The emulator is instrumented to count selection clicks, and to measure user task completion times.
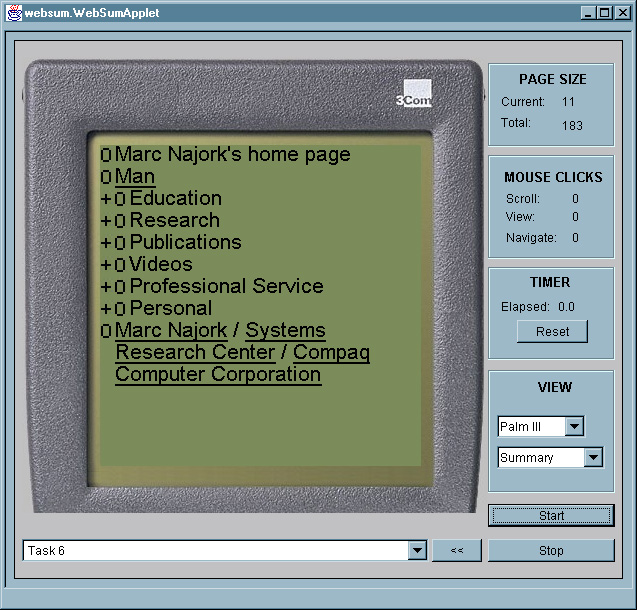
Four panels are aligned in a column to the right of the emulator's PDA/phone display (Figure 12). The top panel provides information about the current state of the display. The current page size gives the total number of lines that are currently visible. This number changes as the emulator is switched among PDA and cellular phone mode. The total page size shows the number of lines currently available, either being displayed, or accessible through scrolling. The mouse panel maintains a running count of user activity. The scroll entry shows the cumulative number of mouse clicks expended for scrolling. The view entry accrues mouse clicks used for expanding and collapsing STUs and the structural hierarchy (the '+' and '-' controls of Figure 1). The navigation entry tracks how often users follow links. The view panel, finally, contains two pull-down list controls. The first is used to change which device is being emulated, PDA or cellular phone. The second pull-down list allows the operator to choose between the five methods for STU display (Incremental, Keyword, etc.).
Below the device display, a pull-down list is used to select a starting URL, or a task identifier, which is internally translated into a starting URL. The start button is pushed at the beginning of each experimental session. The stop button ends the session and saves all user data to disk. The '<<' button acts like a browser 'BACK' button, and returns to a previous URL. This button is only used for experiments that involve browsing.
When using the emulator for an experiment, the subject or the operator selects one of the methods from the pull-down list in the view panel. A task is selected in the task/URL selection field. The start button begins the experiment, the stop button ends it. Each task for the series of experiments reported on here involved a single Web page and one question about that page. We limited tasks to cover only a single page to ensure that we restricted measurements to cover summarization issues, as opposed to browsing artifacts, such as network delays, false trails, and subjects' adjustment to different page styles. Subjects used the mouse to expand and collapse portions of each page, and to open or close STUs as they looked for the answers to questions we posed about the page.
We selected Web pages for these tasks to be of varying length, but large enough not to fit on a single PDA screen. The questions we asked varied as well. Some questions requested subjects to find a particular link on the page. Others asked subjects to find particular pieces of content within the page. Each question had a well-defined answer, rather than being open-ended. Web pages and questions were selected without our viewing the results of the summarization. Table 1 shows the list of 10 tasks that we asked users to perform.
| Description | |
| Task 1 | From the Bureau of Census home page find a link to News for Federal Government Statistics. |
| Task 2 |
From the Lonely Planet Honk Kong Web page find when
the Hong Kong Disneyland is going to open. |
| Task 3 | From the Stanford HCI Page, find the link to Interaction Design Studio. |
| Task 4 | From the WWW10 Conference home page, find the required format for submitted papers. |
| Task 5 | From the 'upcomingmovies' review of the movie Contender: How was the character "Kermit Newman" named? |
| Task 6 | From Marc Najork's Home page find the conference program committees he participated in. |
| Task 7 |
From the science article in Canoe find out:
What percentage of bone cells can be converted to brain cells? |
| Task 8 | From the 'boardgamecentral' Web page find what "boneyard" means in the dominoes game. |
| Task 9 | From the 'zoobooks' Web page find where penguins live. |
| Task 10 | From the Pokemon official site find the price of Pokemon Gold and Silver. |
| Task 1 | Task 2 | Task 3 | Task 4 | Task 5 | Task 6 | Task 7 | Task 8 | Task 9 | Task 10 | |
| # of STUs | 31 | 32 | 26 | 67 | 32 | 33 | 33 | 19 | 18 | 36 |
| # of Lines | 47 | 169 | 306 | 140 | 343 | 120 | 120 | 60 | 100 | 145 |
Table 2 provides statistics about each task's Web page. The average number of STU's on each of our tasks' Web pages was 33. The average total page length was 155 PDA lines. The number of sentences in each STU varied from 1 to 10. The number of lines in each STU varied from 1 to 48. A Palm Pilot device can display 13 lines at a time with our browser, the cellular phone device can display eight. Given the PDA's screen size, a 48-line STU would be displayed as 4 pages on the PDA and 6 pages on the cellular phone. The one-line STUs would fit on a single page. In short, we ensured that we exposed users to STUs of widely varying lengths. Some easily fit onto one screen, others required scrolling when expanded.
For our experiment, we consecutively introduced 15 subjects with strong World-Wide Web experience and at least some Computer Science training to our five STU exploration methods. Each subject was introduced to the emulator, and allowed to complete an example task using each of the methods. During this time, subjects were free to ask us questions about how to operate the emulator, and how to interact with the browser for each of the methods. Once we had answered all of the subject's questions, we handed him a sheet of paper that instructed him on the sequence in which he was to run through the tasks, and which method to use for each. Subjects clicked the start button once they had selected a task and method. This action displayed the collapsed Web page for the task. Once subjects had found the answer to the task's question by opening and closing the structural hierarchy and individual STUs, they clicked the stop button.
The instructions we gave to each subject had them use each method twice (for different tasks). We varied the sequence in which subjects used the methods. In this way each task was tackled with different methods by different subjects. We took this step to exclude performance artifacts based on method order, or characteristics of the matches between particular tasks and methods.
Figure 13 summarizes the average task completion time for each method. The figure shows that in six out of 10 tasks method Incremental performed better than the ALL method. The methods are thus close in their effectiveness. These results seem to indicate that showing the first line of the first sentence is often not effective, probably because STUs on the Web are not as well structured as paragraphs in carefully composed media, such as, for example, articles in high-quality newspapers. Thus, showing the full text of the STU and letting the user scroll seems to be as effective as first showing just the first sentence. Recall however, that the ALL method shows the entire text of a single STU, not the text of the entire page. Thus the '+/-' structural controls are still being used even for the ALL method.
We see that for one half of all tasks (5 out of 10), the Summary method gave the best task completion time, and for the other half, the Summary/Keyword method yielded the best time. The time savings from using one of these summarization techniques amount to as much as 83% compared to some of the other methods! Using at least one of these techniques is thus clearly a good strategy.
Notice that both pairs Incremental/ALL, and Summary/Keyword-Summary tend to be split in their effectiveness for any given task. In the case of Incremental and ALL, the completion time ratio between the methods was at least two in five of our 10 tasks. In Task 2, for example, Incremental took about 80 seconds, while ALL required 160 seconds for completion, a ratio of 2. On the other hand, ALL was much better than Incremental in Task 7. Similarly, Keyword and Keyword/Summary had completion time ratios of two or higher in five of 10 tasks. In contrast, Keyword and Summary more often yielded comparable performance within any given task. Given that Summary and Keyword/Summary are the two winning strategies, we need to understand which page characteristics are good predictors for choosing the best method. We plan to perform additional experiments to explore these predictors.
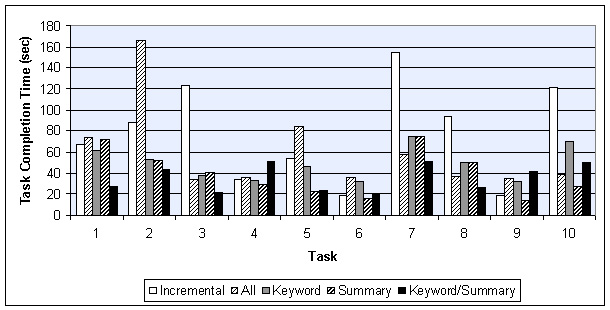
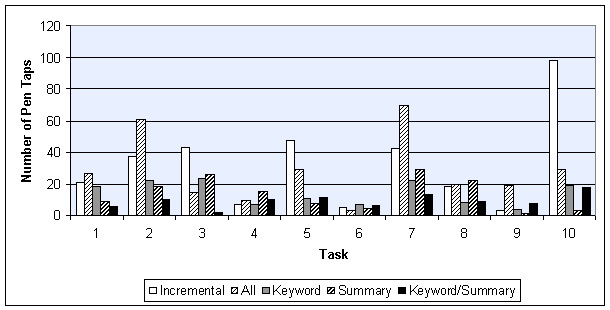
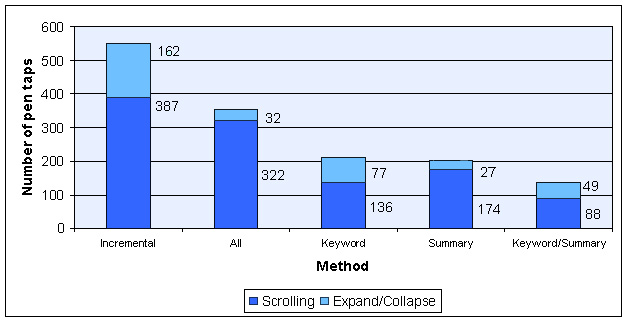
Figure 14 similarly summarizes I/O cost: the number of pen taps subjects expended on scrolling and the expansion and collapse of STUs. Notice that in most of the cases either Summary or Keyword/Summary gave the best results, reinforcing the timing results of Figure 13. The reward for choosing one of the summarization methods is even higher for I/O costs. We achieve up to 97% savings in selection activity by using one of the summarization methods.
Before processing the results of Figures 13 and 14 further to arrive at summary conclusions about our methods, we examined the average completion time for each user across all tasks. Figure 15 shows that this average completion time varied among users.
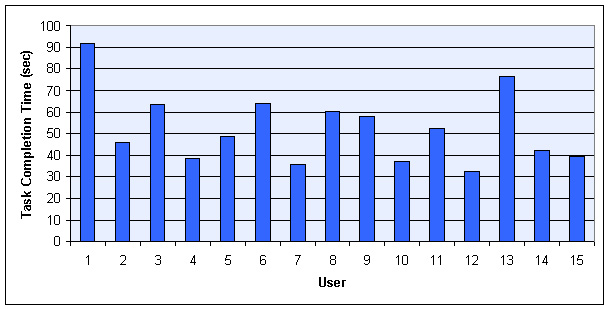
This variation is due to differences in computer experience, browsing technique, level of concentration, and so on. In order to keep the subsequent interpretation of these raw results independent from such user differences, we normalized the above raw results before using them to produce the additional results below. The purpose of the normalization was to compensate for these user variations in speed. We took the average completion time across all users as a base line, and then scaled each user's timing results so that, on the average, all task completion times would be the same. The average completion time for all users over all tasks was 53 seconds.
To clarify the normalization process, let us assume for simplicity that the average completion time was 50 seconds, instead of the actual 53 seconds. Assume that user A performed much slower than this overall average, say at an average of 100 seconds over all tasks. Assume further that user B performed at an average of 25 seconds. For the normalization process, we would multiply all of user A's individual completion times by 1/2, and all of B's times by 2.
With these normalized numbers, we summarized the timing and I/O performance for each method (Figures 16 and 17). Recall that I/O performance is the sum of all mouse/pen actions (scrolling, opening and closing STU's, etc.).
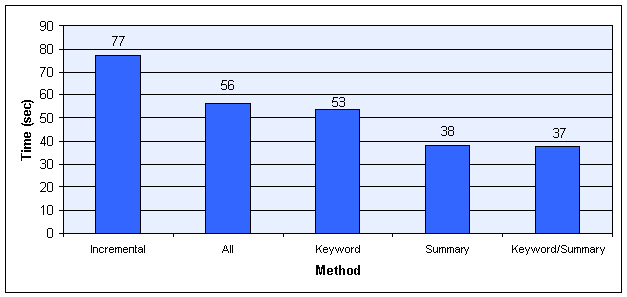
Notice that ALL and Keyword are comparable in completion time. One explanation for this parity could be that our keyword selection is not good. A more likely explanation is that for our, on the average, short STU lengths, a quick scan is faster than making sense of the keywords.
Notice that on average, Summary and Keyword/Summary produce a 39 second gain over Incremental, and an 18 second gain over ALL. The two methods are thus clearly superior to the other methods. In Figure 16 the two methods are head-to-head in timing performance.
As we see in Figure 17, however, Keyword/Summary requires 32% fewer input effort than Summary. This difference gives Keyword/Summary an advantage, because user input controls on PDAs are small, and users need to aim well with the input pen. On a real device, this small scale thus requires small-motor movement control. Operation in bumpy environments, such as cars, can therefore lead to errors. The combination of Figures 16 and 17 therefore give Keyword/Summary the lead in overall performance.
The difference in timing vs. I/O performance for Keyword/Summary is somewhat puzzling, as one would expect task completion time to be closely related to I/O effort. We would therefore expect Keyword/Summary to do better in timing performance than Keyword. We believe that the discrepancy might be due to the cognitive burden of interpreting keywords. That is, looking at the complete summary sentence is easier than examining the keywords, as long as the summary sentence is not too long.
In summary, we conclude from our studies that the Keyword/Summary method is the best method to use for finding answers to questions about individual Web pages on PDAs. While the keywords require some mental interpretative overhead, the savings in input interaction tips the balance to Keyword/Summary, even though this method's timing performance is comparable with that of Summary.
Recall that the deployment platform for our system is a wirelessly connected PDA. The amount of information that is transferred from the Web proxy to the PDA is therefore an important system-level parameter that must be considered in an overall evaluation. This information flow impacts the bandwidth requirements, which is still in short supply for current wireless connections.
Table 3 summarizes the bandwidth-related properties of each task's Web page. Column 1 shows the total number of bytes occupied by a fully displayed HTML page, when images and style sheets are included. Column 2 shows the size once images and style sheets are removed from the total. The third column lists the number of bytes our system sends when transmitting STUs. The average 90% savings of Column 3 over Column 1 stem from stripping HTML formatting tags, and the discarded images. If we just consider the HTML and ignore images, the average savings is 71%. Note that these transmission times are not included in our timing data, since we were using the emulator for our experiments. The numbers in Column 3 are for the ALL method. The Keyword, Summary, and Keyword/Summary methods require additional data to be transmitted: the keywords, and the start and end indexes of the summary sentences in the transmitted data. On average over all tasks, this additional cost is just 4% for Summary, 24% for Keyword, or 28% for Keyword/Summary. Even for the latter worst case this still leaves a 87% savings in required bandwidth for our browser.
| Page Size (Total bytes) |
Page Size (HTML bytes) |
Packet Size (All) |
Size Savings (Compared to Full page) |
|
| Task 1 | 51,813 | 18,421 | 1193 | 97.7% |
| Task 2 | 45,994 | 18,309 | 4,969 | 89.2% |
| Task 3 | 66,956 | 12,781 | 9,762 | 85.4% |
| Task 4 | 17,484 | 11,854 | 3,736 | 78.7% |
| Task 5 | 55,494 | 21,276 | 10,913 | 80.3% |
| Task 6 | 23,971 | 6,583 | 1,079 | 95.5% |
| Task 7 | 75,291 | 35,862 | 5,877 | 92.2% |
| Task 8 | 44,255 | 9,394 | 1,771 | 96.0% |
| Task 9 | 19,953 | 7,151 | 3,042 | 84.8% |
| Task 10 | 114,678 | 17,892 | 4,342 | 96.2% |
Notice, that a 87% reduction in required bandwidth is highly significant when operating our browser in a wireless environment. To see this significance, consider that in terms of transmission time over wireless links, an average size page (over the 10 tasks) would take seven seconds for the ALL method on one popular wireless network. Sending all of the HTML as well would take 24 seconds over the same network. If images and style sheets were added in addition, transmission of an average page would take up 77 seconds! Compared to a browser that sends the full page, our browser's bandwidth parsimony would therefore amount to an 11-fold improvement. Even a browser that discarded images and style sheets, but transmitted all of the HTML tags would require three times more bandwidth than our solution. The computation time for transforming the original Web pages on the fast proxy is negligible, compared to the transmission time.
Our Power Browser draws on two research traditions. The first is the search for improving user interaction with text by designing non-linear approaches to text displays and document models. Projects in the second tradition have examined design choices for displays on small devices.
One body of work in the first tradition has explored effective ways of displaying documents and search results through the use of structured browsing systems. See for example [6,9, 22]. The long-standing Hypertext community [8] has focused on tree structures for interacting with multiple documents [10] and large table of contents [7]. The Cha-Cha system allows users to open and collapse search results. In this sense that system is similar to our displaying individual Web pages as nested structures. But Cha-Cha applies this concept over multiple pages, and the display is pre-computed. The part of our Power Browser that we introduced in this paper focuses on a single Web page, and all displays are dynamically computed.
Similarly, Holophrasting interfaces [25] have aimed to provide visualization of textual information spaces by providing contextual overviews that allow users to conceal or reveal the display of textual regions. We use the Holophrasting principle for our STUs. But rather than progressively disclosing a fixed body of text, some of the methods we explored here apply Holophrasting to transformations of the text, such as summaries or keywords.
Numerous approaches to browsing the Web on small devices have been proposed in work of the second abovementioned tradition. Digestor [2] provides access to the World-Wide Web on small-screen devices. That system re-authors documents through a series of transformations and links the resulting individual pieces. Our technique is more in the tradition of Fisheye Views [12], where a large body of information is displayed in progressively greater detail, with surrounding context always visible to some extent.
Ocelot [1] is a system for summarizing Web pages. Ocelot synthesizes summaries, rather than extracting representative sentences from text. The system's final result is a static summary. Ocelot does not provide progressive disclosure where users can drill into parts of the summary, as we do in the Power Browser. Another system, WebToc [18], uses a hierarchical table of contents browser; that browser, however, covers entire sites, and does not drill into individual pages.
Similar to our Partition Manager, the system described in [15] applies page partitioning to Web pages. The purpose of that system's partitioning efforts, however, is to convert the resulting fragments to fit the 'decks' and 'cards' metaphor of WAP devices.
As small devices with wireless access to the World-Wide Web proliferate, effective techniques to browse Web pages on small screens become increasingly vital. In this paper, we developed a new approach to summarize and browse Web pages on small devices. We described several techniques for summarizing Web pages, and for progressively disclosing the summaries. Our user experiments showed that a combination of keyword extraction and text summarization gives the best performance for discovery tasks on Web pages. For instance, compared to a scheme that does no summarization, we found that for some tasks our best scheme cut the completion time by a factor of 3 or 4.
Orkut Buyukkokten is a Ph.D. student in the Department of Computer Science at Stanford University, Stanford, California. He is currently working on the Digital Library project and is doing research on Web Browsing and Searching for personal digital assistants.
Hector Garcia-Molina is a professor in the Departments of Computer Science and Electrical Engineering at Stanford University, Stanford, California. His research interests include distributed computing systems, database systems and Digital Libraries.
Andreas Paepcke is a senior research scientist and director of the Digital Library project at Stanford University. For several years he has been using object-oriented technology to address interoperability problems, most recently in the context of distributed digital library services. His second interest is the exploration of user interface and systems technologies for accessing digital libraries from small, handheld devices (PDAs).