Administration Guide
The Device List shows all devices in the system. From this view, you can search for devices and perform a range of device management tasks.
To access the device list, select Device List from the navigation menu.
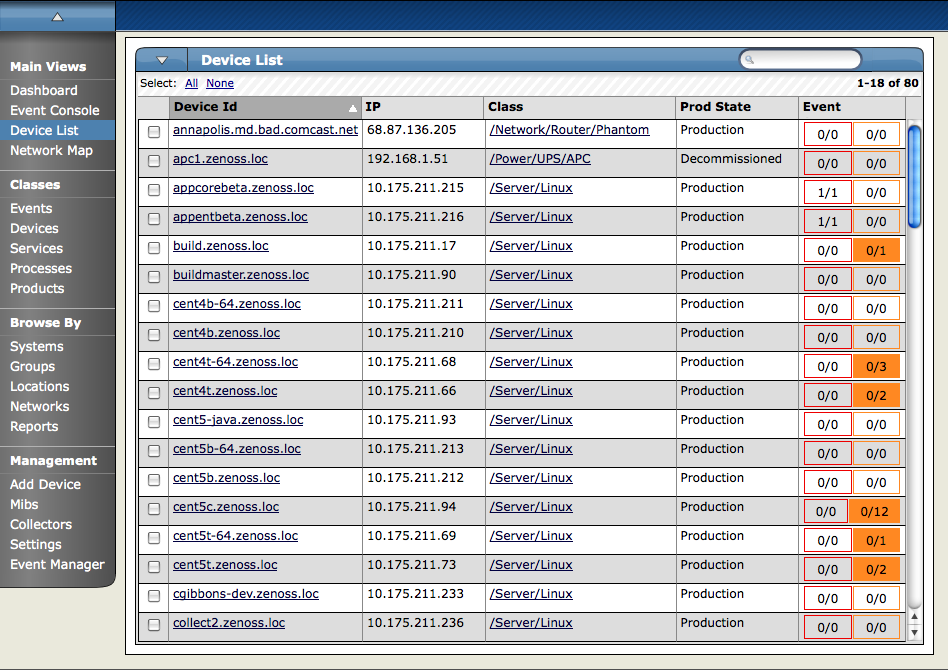
To view a single device, click its name in the list. The Device page appears.
Zenoss assigns properties and attributes to each device in the system. It categorizes this information and makes it available from tabs located at the top of the Device page.
The Status tab appears when you select a device from the device list.
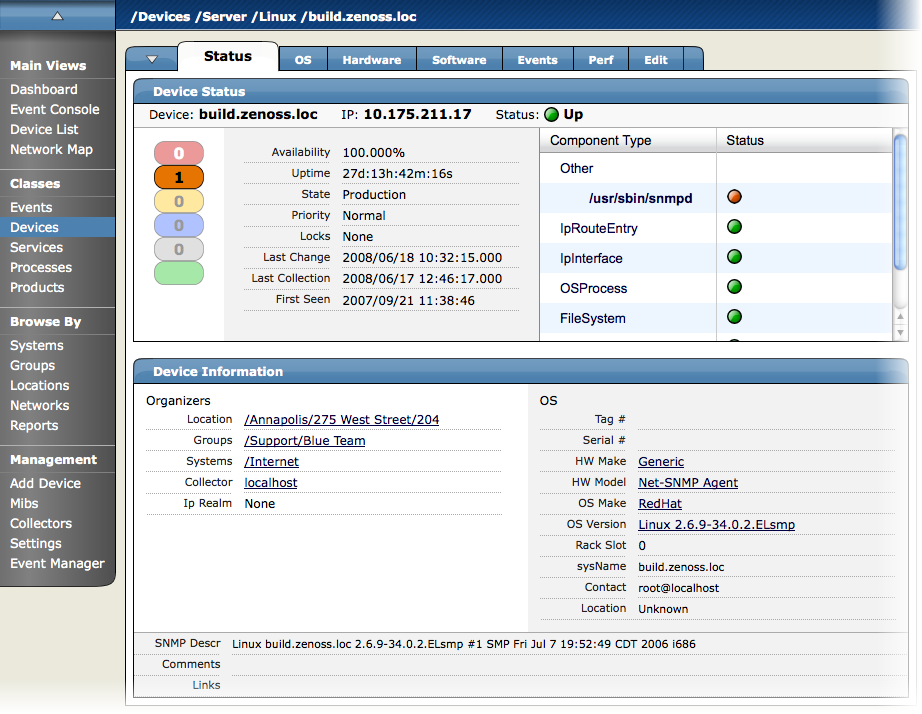
Device Status Table
The Device Status table provides important device status at a glance. Events, grouped by severity, are found at the left side of this table. Click the indicators in this "event rainbow" to view the list of events for the device.
Key information appears at the top of the Device Status table:
Device - Displays the device name.
IP - Displays the device IP address. Zenoss uses this address to communicate with the device.
Status - Shows the current results of the ping test.
Additional device status information appears to the right of the event rainbow:
Availability - Shows seven-day availability, as defined by the availability of the device by measuring ping. Duration is specified by the Default Availability Report (accessible from the Event Manager area).
Uptime - Duration the device has been "up" and running, as reported by the agent on the device. This information can be acquired through SNMP, WMI, or SSH.
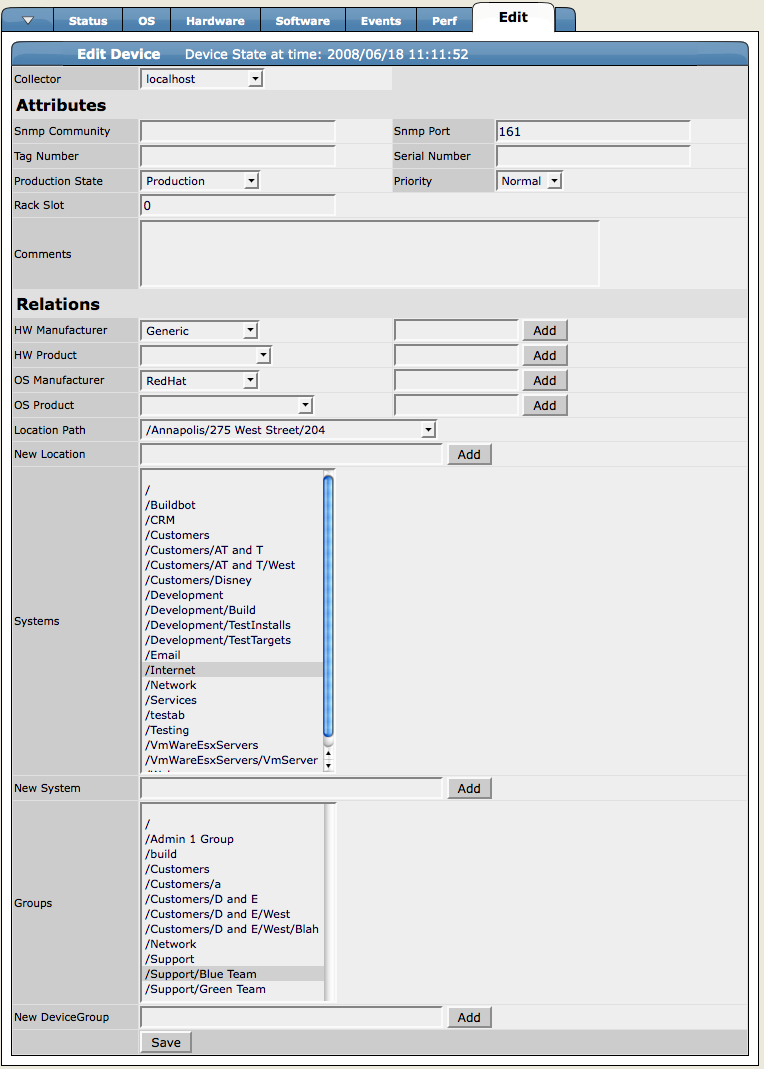
State - Set this value from the Device page Edit tab. Indicates one of these device states:
Production - Zenoss monitors devices in production, reporting issues on the dashboard and sending event notifications.
Maintenance - Zenoss collects data for devices in maintenance, but does not report issues or send event notifications.
Decommissioned - Zenoss does not monitor the device.
Priority - Ranks the importance of your devices. You can use priority settings to control alerts. Set this value from the Device page Edit tab.
Locks - Prevent the modeler from overriding custom changes. Set locks from the Device page menu, from the Manage > Lock Devices selection.
For more information about locking devices, refer to the section titled "Locking Device Configuration."
Last Change - Displays the latest time the modeler detected a change on the device and updated its entry in Zenoss.
Last Collection - Displays the latest time the modeler checked for changes to the device.
First Seen - Displays the date and time the device was added to Zenoss.
Component Status
On the right side of the Device Status table is the Component Status list. Each item in the list is a type of device component, such as IPService, WinService, IpRouteEntry, IpInterface, CPU, and FileSystem. Click the indicators in the Status column to view the event page for that component.
The status of each device component type, as shown by the color of its indicator, is determined by the collective status of the monitored components of the same type. For example, if the IpService status is green, then all monitored IpServices on this device are functioning normally. If there is an event related to a monitored IpService, then the component and highest severity event associated with that component are displayed in the status.
If there is an event unrelated to a known component, then Zenoss places it in the component type Other.
Device Information
The Device Information area provides system information and details about the device's organizers.
Organizers - Identifies the groups in which you have included this device. It also displays values for:
Collector - If your Zenoss implementation uses a single collector, then this value is "localhost." If your Zenoss implementation uses distributed collectors, then this value is the name of the collector that monitors the device.
IP Realm - Specifies an advanced configuration value for the MultiRealmIP ZenPack.
OS - Shows system information returned by the device collectors. The details provided in this area vary, depending on data collection method.
The lowest section of the Device Information area includes Links, which displays links between this device and other external systems. Links are implemented by the zlinks zProperty.
For more information about custom links, see the chapter titled "Properties and Templates."
The OS tab shows a detailed breakdown of all of the operating system components found by the modeling process. For each of these components, you can see current status, names, and lock status.
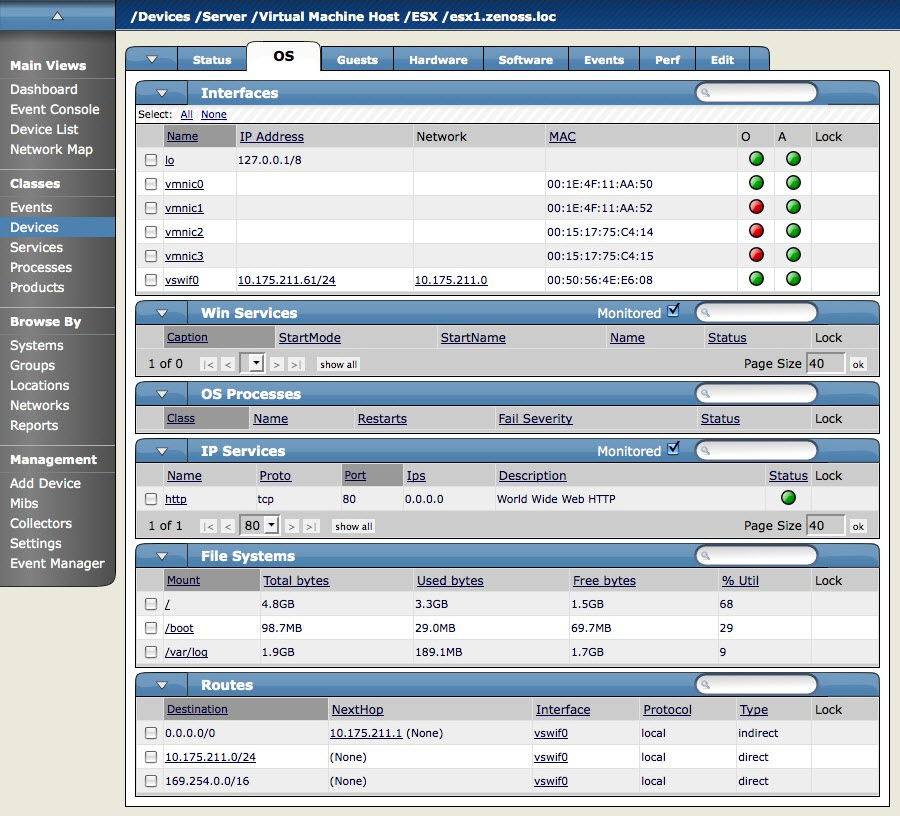
Monitored Selection
Some areas of the OS tab feature a Monitored option, which filters the list of interfaces shown in that area. To view all interfaces, de-select this option. If you want to view only those interfaces that Zenoss is monitoring, then select the option.
Interfaces
The Interfaces area shows basic information about each of the logical and physical network interfaces that Zenoss models.
In the IP Address column, addresses may be links to additional information in the network information database.
The red and green status indicators in this area provide at-a-glance information about the status of each network listed:
O - Indicates that the network is operationally online, meaning that the network interface is operating when the indicator shows green.
A - Indicates whether the network is administratively up, meaning that it has been configured to operate when the indicator shows green.
M - If the indicator is green, Zenoss is monitoring this network; if red, then Zenoss is not monitoring it.
Win Services
This area shows detailed information about the status of Windows-based services. Key information in this area includes:
StartMode - Windows services with a start mode of disable or manual are monitored by Zenoss.
StartName - Indicates the user under which the service runs.
OS Processes
Shows OS processes for this device. After adding an OS process, you should re-model the device.
The Restarts column shows whether Zenoss will generate an event if the process is detected as restarted.
IP Services
The IP Services area shows the TCP and UDP ports that are currently listening on a device. Zenoss monitors only TCP ports.
Make sure you have TCP connectivity between your Zenoss server and the monitored server.
Key information in this area includes:
Ips - In most cases, shows 0.0.0.0, which indicates that the service is listening on all IP addresses.
Status - If the status indicator is green, then the TCP port check succeeded; if red, then it did not succeed.
File Systems
This area lets you view file system status, if file system monitoring is enabled. To enable file system monitoring, select Monitoring from the File Systems table menu, and then select the Enable option in the dialog.
File systems can be monitored via SNMP only if the system has a valid HOST-RESOURCES MIB.
If "Unknown" appears in the Used bytes, Free bytes, or % Util columns, then performance collection may not yet have begun.
Zenoss monitors the amount of blocks used and shows:
Total bytes
Available bytes
Used bytes
Percentage used
Routes
Routes are collected to model the network topology so that root cause analysis can be determined by the Zenoss server. Routes are not monitored.
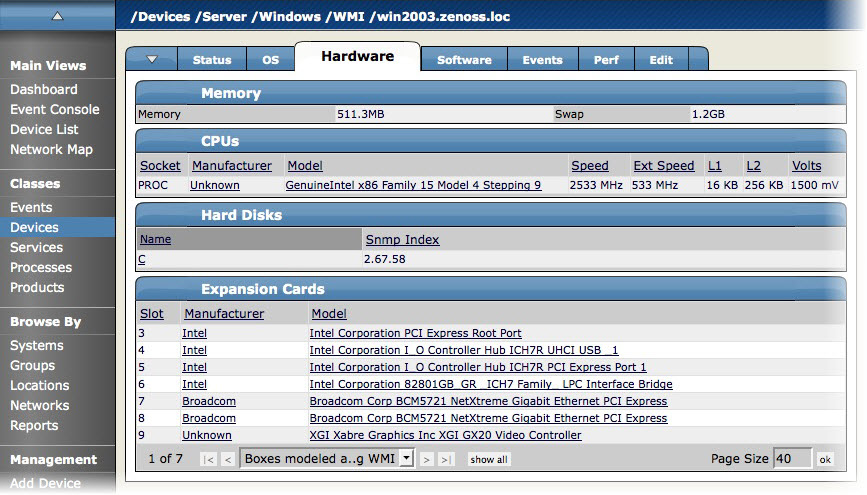
The Hardware tab shows a detailed breakdown of all of the hardware components found by the modeling process. This area might provide information about the device's available and used memory, available and used swap space, CPUs, hard disks, expansion cards, fans, temperature sensors and power supplies.
The information show in this area varies depending on the device type.
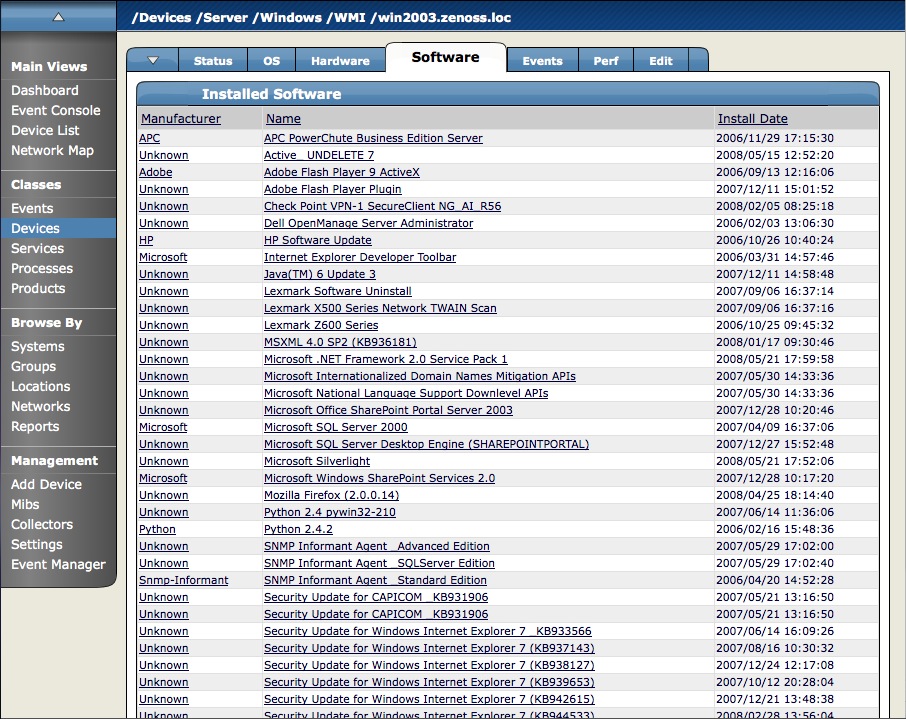
The Software tab lists software installed on the device. The details provided in this area depend on the method used to model the device.
Listed software links into Zenoss' inventory of software in your IT infrastructure. You can view this inventory from the Products link on the Navigation menu.
The Events tab provides events information that is scoped to the device. From here, you can:
Sort event information by component, event class, or count.
Move, map, and acknowledge events.
Filter events by severity, state, or by using a regular expression applied to all events.
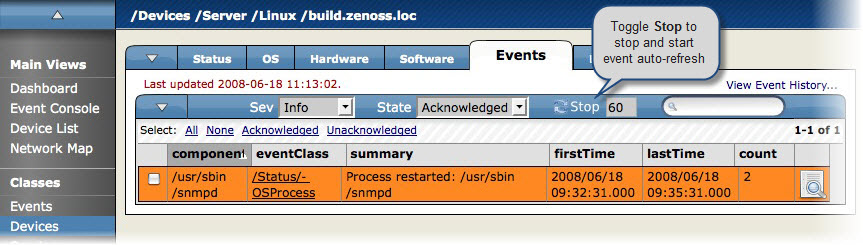
For detailed information about the event console and how Zenoss handles events, see the chapter titled "Event Management."
The Perf tab shows performance graphs defined for the currently selected device.
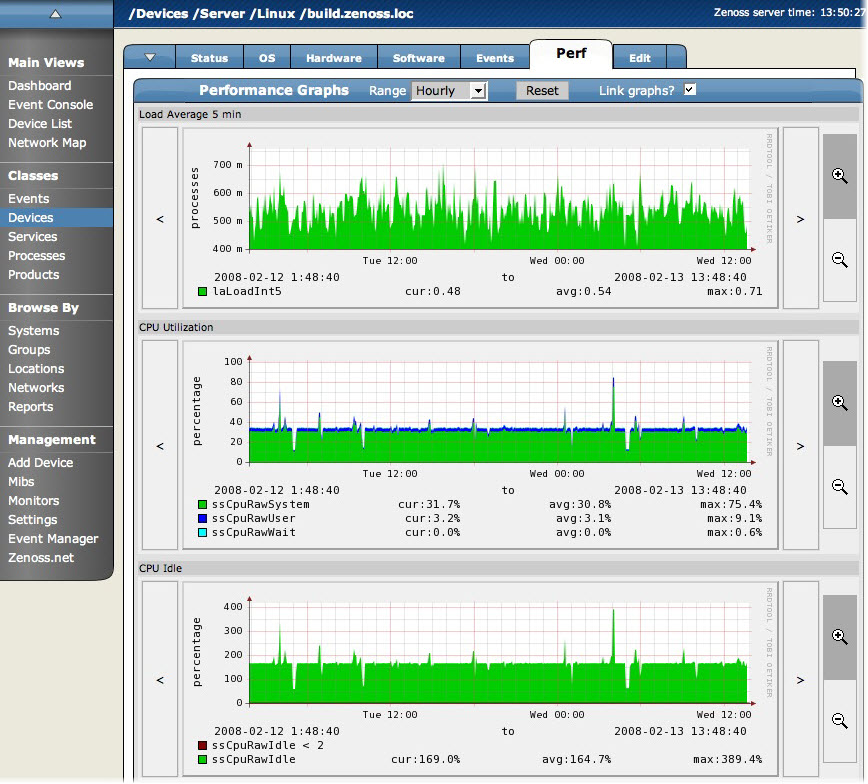
You can use the arrow key and magnifying glass controls on the sides of each graph to change the graph view, scrolling through or zooming in or out of a graph.
From this tab, you can control these performance graph options:
Range - Select the span of time displayed in the graph. You can select Hourly (past 36 hours), Daily (past 10 days), Weekly (past six weeks), Monthly (past 15 months), or Yearly (past two years).
Reset - Click to return to the default (initial view) of the graphs.
Link graphs - By default, all graphs move together. If you click the back arrow for a graph, for example, then all graphs move backward. De-select the Link graphs option to control each graph individually.
Stop - Turns off automatic refresh of the graphs.
For more information about Zenoss performance monitoring and defining performance graphs, see the section titled "Performance Monitoring."