Administration Guide
Read this chapter to learn about Zenoss performance monitoring and performance templates.
Zenoss uses several methods to monitor performance metrics of devices and device components. These are:
ZenPerfSNMP - Collects data through SNMP from any device correctly configured for SNMP monitoring.
ZenWinPerf (Zenoss Enterprise only) - ZenPack that allows performance monitoring of Windows servers.
ZenCommand - Logs in to devices (by using telnet or ssh) and runs scripts to collect performance data.
Other ZenPacks - Collect additional performance data. Examples include the ZenJMX ZenPack, which collects data from enterprise Java applications, and the HttpMonitor ZenPack, which checks the availability and responsiveness of Web pages.
Regardless of the monitoring method used, Zenoss stores performance monitoring configuration information in performance templates.
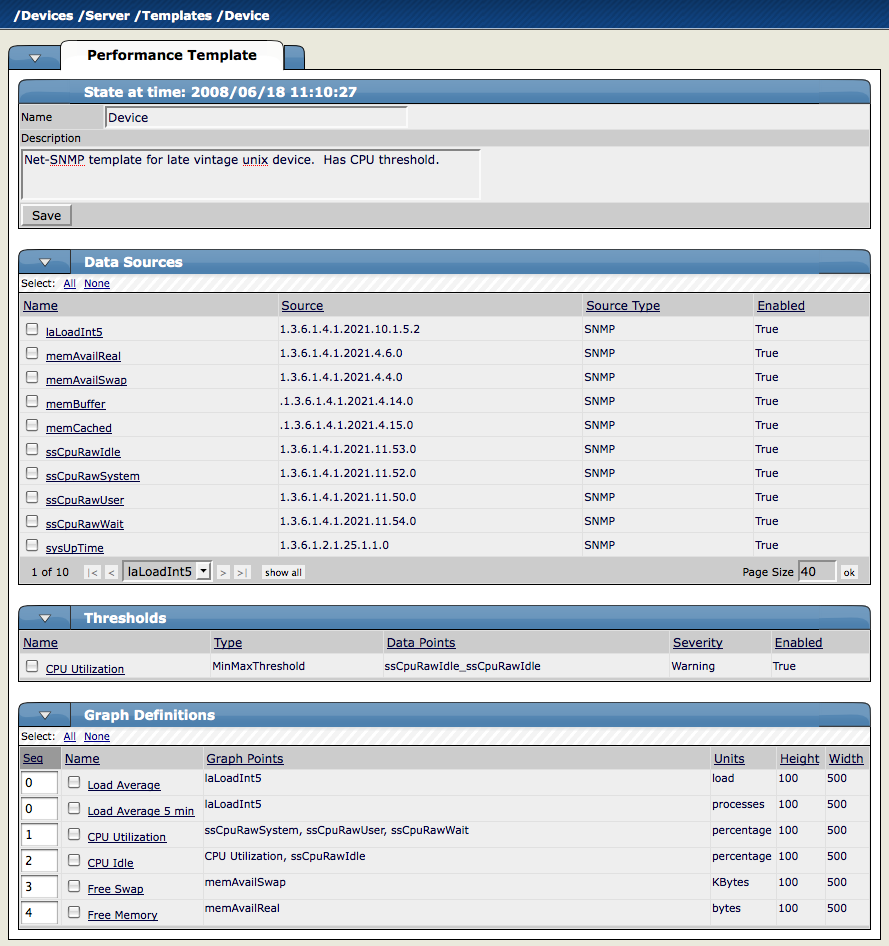
Performance templates determine how Zenoss collects performance data for devices and device components. You can define performance templates for device classes and for individual devices.
Templates comprise three types of objects:
Data Sources - Specify the exact data points to collect, and the method to use to collect them.
Thresholds - Define expected bounds for collected data, and specify events to be created in Zenoss if the data does not match those bounds.
Graph Definitions - Describe how to graph the collected data on the device or device components.
Before Zenoss can collect performance data for a device or component, it must determine which templates apply. This process is called template binding.
The Templates page lists all of the performance templates available to a device or device class.
To view available performance templates for a device, select More > All Templates from the Devices page menu. To view available performance templates for device classes, click the Templates tab from the Devices area.
The Available Performance Templates page shows the performance templates that are defined for a particular device or device class, and for those defined further up the device class hierarchy. If more than one template of the same name is defined, then only the one to which this device or device class can bind appears in the list.
Click a template in the list to view details about defined data sources, thresholds, and to see graph definition details.
Before Zenoss can collect performance data for a device or component, it must determine which templates apply. This process is called template binding.
First, Zenoss determines the list of template names that apply to a device or component. For device components, this usually is the meta type of the component (for example, FileSystem, CPU, or HardDisk). For devices, this list is defined by the zDeviceTemplates zProperty.
After defining the list, Zenoss locates templates that match the names on the list. For each name, Zenoss searches the device and then searches the device class hierarchy. Zenoss uses the lowest template in the hierarchy that it can locate with the correct name, ignoring others of the same name that might exist further up the device class hierarchy.
Viewing Templates Available for Binding
To see which templates are available for binding, view the Templates page for any device or device class. This page shows all templates that are defined at this point or higher in the device hierarchy.
Changing Templates Available for Binding
To change which templates are currently bound:
Select Bind Templates from the Available Performance Templates table menu.
The Bind Performance Templates dialog appears.
Select a performance template (Ctrl-Click to select more than one), and then click OK.
The selected performance template appears in the list of available templates.
Note
Alternatively, you can edit the zDeviceTemplates zProperty (from the zProperties page) to change which templates are bound. You cannot edit the bound name for a device component.
| Name Binding | Definition |
|---|---|
| Device | The device object. (These OIDs do not have an snmp index number.) |
| FileSystem | The file system object currently uses the host resources MIB. |
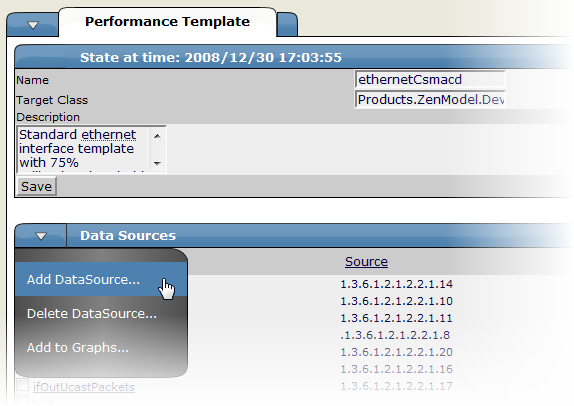
| Interface | Interfaces are bound using their interface type. (For example: ethernetCsmacd.) |
| HardDisk | Hard disk object for I/O stats, such as Windows boxes with Informant MIB. |
Data sources specify which data points to collect and how to collect them. Each performance template comprises one or more data sources. Zenoss provides two built-in data source types: SNMP and COMMAND. (Other data source types are provided through ZenPacks.)
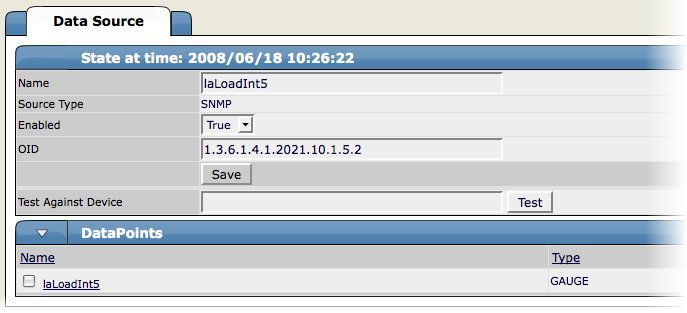
About SNMP Data Sources
SNMP data sources define data to be collected via SNMP by the ZenPerfSNMP daemon. They contain one additional field to specify which SNMP OID to collect. (Many OIDs must end in .0 to work correctly.) Because SNMP data sources specify only one performance metric, they contain a single data point. For more information, see the section titled SNMP Monitoring.
About COMMAND Data Sources
COMMAND data sources specify data to be collected by a shell command that is executed on the Zenoss server or on a monitored device. The ZenCommand daemon processes COMMAND data sources. A COMMAND data source may return one or more performance metrics, and usually has one data point for each metric.
Shell commands used with COMMAND data sources must return data that conforms to the Nagios plug-in output specification. For more information, see the section titled Monitoring Using ZenCommand.
To add a data source to a performance template:
Data sources can return data for one or more performance metrics. Each metric retrieved by a data source is represented by a data point.
Defining Data Points
You can define data points to data sources with all source types except SNMP and VMware. Because these data source types each rely on a single data point for performance metrics, additional data point definition is not needed.
To add a data point to a data source:
Select a data source from the Data Sources area of the Performance Template page.
From the DataPoints table menu on the Data Source page, select Add Datapoint.
In the Add a New DataPoint dialog, enter a name for the data point, and then click Add.
Note
For COMMAND data points, the name should be the same as that used by the shell command when returning data.
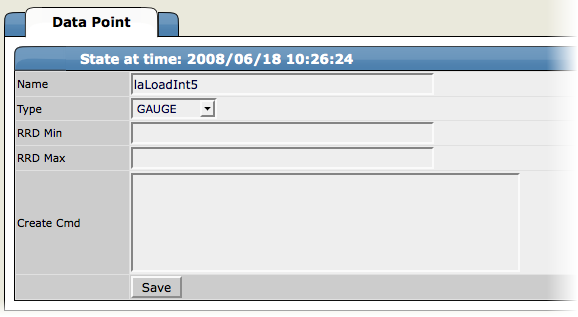
Enter information or make selections to define the data point.
Name - Displays the name you entered in the Add a New DataPoint dialog.
Type - Specify the RRD data source type to use for storing data for this data point. (Zenoss uses RRDTool to store performance data.) Available options are:
COUNTER - Saves the rate of change of the value over a step period. This assumes that the value is always increasing (the difference between the current and the previous value is greater than 0). Traffic counters on a router are an ideal candidate for using COUNTER.
DERIVED - Same as COUNTER, but additionally allows negative values. If you want to see the rate of change in free disk space on your server, for example, then you might want to select this value.
ABSOLUTE - Saves the rate of change, but assumes that the previous value is set to 0. The difference between the current and the previous value is always equal to the current value. Thus, ABSOLUTE stores the current value, divided by the step interval.
GAUGE - Does not save the rate of change, but saves the actual value. There are no divisions or calculations. To see memory consumption in a server, for example, you might want to select this value.
Note
Rather than COUNTER, you may want to define a data point using DERIVED and with a minimum of zero. This creates the same conditions as COUNTER, with one exception. Because COUNTER is a "smart" data type, it can wrap the data when a maximum number of values is reached in the system. An issue can occur when there is a loss of reporting and the system (when looking at COUNTER values) thinks it should wrap the data. This creates an artificial spike in the system and creates statistical anomalies.
RRDMin - Enter a value. Any value received that is less than this number is ignored.
RRDMax - Ener a value. Any value received that is greater than this number is ignored.
Create CMD - Enter an RRD expression used to create the database for this data point. If you do not enter a value, then Zenoss uses a default applicable to most situations.
For details about the rrdcreate command, go to:
Click Save to save the data point.
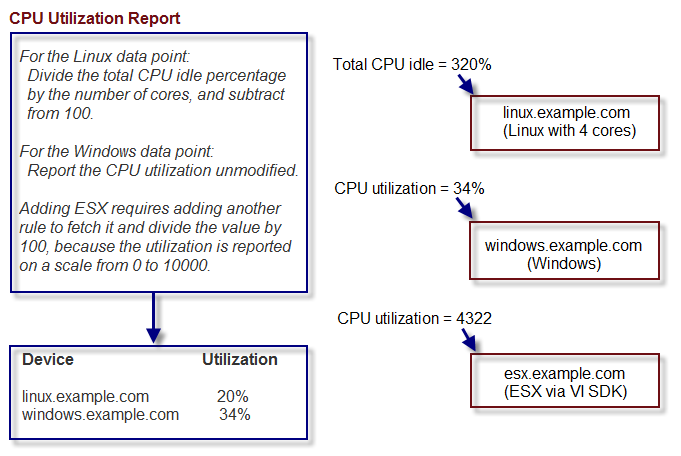
Zenoss performance reports pull information from various data points that represent a metric. The report itself knows which data points it requires, and which modifications are needed, if any, to put the data in its proper units and format.
The addition of a data point requires changing the report.
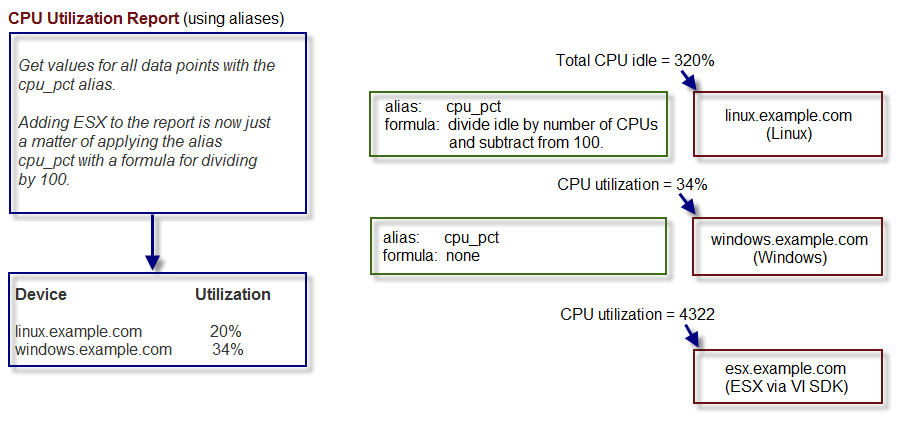
To allow for more flexibility in changes, some Zenoss reports use data point aliases. Data point aliases group data points so they can be more easily used for reporting. In addition, if the data points return data in different units, then the plugin can normalize that data into a common unit.
An alias-based report looks up the data points that share a common alias string, and then uses them. This approach allows you to add data points without changing the report.
In the simplest cases, data from the target data points are returned in units expected by a report. For cases in which data are not returned in the same units, an alias can use an associated formula at the data point. For example, if a data point returns data in kilobytes, but the report expects data in bytes, then the formula multiplies the value by 1024.
Zenoss evaluates the alias formula in three passes.
When complete, the alias formula must resolve to a Reverse Polish Notation (RPN) formula that can be used by RRDtool. For the simple conversion of kilobytes into bytes, the formula is:
1024,*
For more information on RRDtool and RPN formulas, browse to this site:
For cases in which contextual information is needed, the alias formula can contain a TALES expression that has access to the device as context (labeled as "here"). The result of the TALES evaluation should be an RRD formula.
For example, if the desired value is the data point value divided by total memory, the formula is:
${here/hw/totalMemory},/For more information on TALES, refer to the appendix in this guide titled "TALES Expressions," or to the TALES Specification 1.3, at:
You also can embed full Python code in an alias formula for execution. The code must construct a string that results in a valid RRD formula. To signal Zenoss to evaluate the formula correctly, it must begin with:
__EVAL:
Using the same example as in the previous section (division by total memory), the formula is:
__EVAL:here.hw.totalMemory + “,/”
To add a data point alias:
Navigate to a data source on a template.
Select a data point.
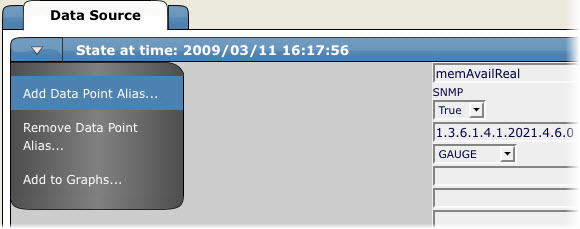
From the page menu, select Add DataPoint Alias.
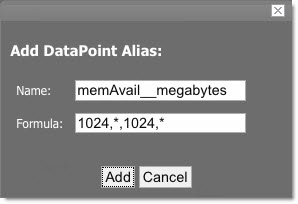
In the Add Data Point Alias dialog, enter the alias name and the formula.
Click Add to add the data point alias.
Thresholds define expected bounds for data points. When a data point goes outside a threshold, then Zenoss creates an event.
Zenoss provides one built-in threshold type: the Min/Max Threshold. Min/Max thresholds inspect incoming data to determine whether exceeds a given maximum or falls below a given minimum. Other threshold types are provided through ZenPacks.
Adding Thresholds
Follow these steps to define a Min/Max threshold for a data point.
From the Performance Template page, select Add a Threshold from the Thresholds table menu.
The Add a New Threshold dialog appears.
Enter an ID for the new threshold, and then click OK.
The Min/Max Threshold page appears.
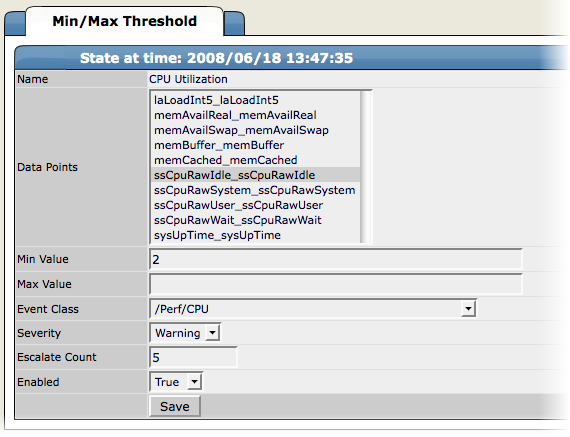
Enter or select values to define the threshold:
Name - Displays the value for the ID you entered on the Add a New Threshold dialog. This name appears on the Performance Template page.
Data Points - Select one or more data points to which this threshold will apply.
Min Value - If this field contains a value, then each time one of the select data points falls below this value an event is triggered. This field may contain a number or a Python expression.
When using a Python expression, the variable
herereferences the device or component for which data is being collected. For example, an 85% threshold on an interface might be specified as:here.speed * .85/8
The division by 8 is because interface speed frequently is reported in bits/second, where the performance data is bytes/second.
Max Value - If this field contains a value, then each time one of the selected data points goes above this value an event is triggered. This field may contain a number or a Python expression.
Event Class - Select the event class of the event that will be triggered when this threshold is breached.
Severity - Select the severity level of the first event triggered when this threshold is breached.
Escalate Count - Enter the number of consecutive times this threshold can be broken before the event severity is escalated by one step.
Enabled - Select True to enable the threshold, or False to disable it.
Click Save to save the threshold.
You can include any of the data points or thresholds from a performance template in a performance graph.
To define a graph:
Navigate to a performance template whose data you want represented in a graph.
From the Graph Definitions table menu, select Add Graph.
The Add a New Graph dialog appears.
Enter the name of the graph, and then click OK.
The Graph Definition page appears.
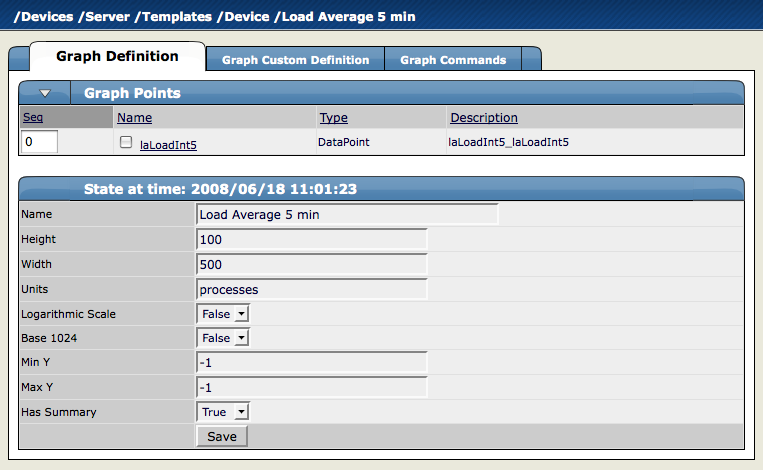
Enter information or select values to define the graph:
Name - Optionally edit the name of the graph you entered in the Add a New Graph dialog. This name appears as the title of the graph.
Height - Enter the height of the graph, in pixels.
Width - Enter the width of the graph, in pixels.
Units - Enter a label for the graph's vertical axis.
Logarithmic Scale - Select True to specify that the scale of the vertical axis is logarithmic. Select False (the default) to set the scale to linear. You might want to set the value to True, for example, if the data being graphed grows exponentially. Only positive data can be graphed logarithmically.
Base 1024 - Select True if the data you are graphing is measured in multiples of 1024. By default, this value is False.
Min Y - Enter the bottom value for the graph's vertical axis.
Max Y - Enter the top value for the graph's vertical axis.
Has Summary - Select True to display a summary of the data's current, average, and maximum values at the bottom of the graph.
Graph points represent each data point or threshold that is part of a graph. You can add any number of graph points to a graph definition by adding data points or thresholds.
From the Graph Points table menu:
Select Add DataPoint, Add Threshold, or Add Custom.
Select values for the graph point, and then click OK.
The new graph point appears on the Graph Definition page.
Note
Thresholds are always drawn before other graph points.
To re-sequence graph points, enter a sequence number in one or more Seq fields and then select Re-sequence GraphPoints from the the Graph Points table menu. The graphs points are re-ordered as specified.
DataPoint graph points draw the value of data points from the template on a graph.
To define a DataPoint graph point:
From the Graph Points table menu, select Add DataPoint.
The GraphPoint dialog appears.
Select one or more data points defined in this template. One DataPoint graph point is created for each data point you select from the list.
Optionally, select the Include Related Thresholds option. If selected, then any graph points are created for any thresholds that have been applied to the select data points as well.
Click OK to add the graph point.
Click the name of the graph point to go to its edit page. Enter information or select values to edit the graph point:
Name - This is the name that appears on the Graph Definition page. By default, it appears in the graph legend.
Consolidation - Specify the RRD function used to graph the data point's data to the size of the graph. Most of the time, the default value of AVERAGE is appropriate.
RPN - Optionally enter an RPN expression that alters the value of the data being graphed for the data point. For example, if the data is stored as bits, but you want to graph it as bytes, enter an RPN value of "8,/" to divide by 8. For more information about RRDTool RPN notation, go to:
Limit - Optionally specify a maximum value for the data being graphed.
Line Type - Select Line to graph the data as a line. Select Area to fill the area between the line and the horizontal axis with the line color. Select None to use this data point for custom RRD commands and do not want it to be explicitly drawn.
Line Width - Enter the pixel width of the line.
Stacked - If True, then the line or area is drawn above the previously drawn data. At any point in time on the graph, the value plotted for this data is the sum of the previously drawn data and the value of this data point now. You might set this value, for example, to asses total packets if measuring packets in and packets out.
Color - Optionally specify a color for the line or area. Enter a six-digit hexadecimal color value with an optional two-digit hex value to specify an alpha channel. An alpha channel value is only used if 'stacked' is True.
Format - Specify the RRD format to use when displaying values in the graph summary. For more information on RRDTool formatting strings, go to:
Legend - Name to use for the data in the graph legend. By default, this is a TALES expression that specifies the graph point name. The variables available in this TALES expression are here (the device or component being graphed) and graphPoint (the graph point itself).
Available RRD Variables - Lists the RRD variables defined in this graph definition. These values can be used in the RPN field.
Threshold graph points graph the value of thresholds from the template.
To add a threshold graph point to the graph definition:
Select Add Threshold from the Graph Points table menu.
The Add GraphPoint dialog.
Select one or more thresholds defined in this template. One threshold graph point is created for each threshold you select in this list.
You can edit values for Name, Color, and Legend for a threshold graph point. Refer to the definitions in the section titled Editing DataPoint Graph Points for more information.
Custom graph points allow you to insert specific RRD graph commands into the graph definition.
For details on DEF, CDEF, and VDEF commands, go to:
http://oss.oetiker.ch/rrdtool/doc/rrdgraph_data.en.html
For details on other RRD commands, go to:
The Custom Graph Definition tab allows you to specify your own set of RRD commands to draw a graph. The graph points specified on the Custom Graph Definition tab are used to define data that is available to the commands you specify here; however, the graph points are not drawn unless you explicitly draw them with the commands you specify here. The Available RRD Variables lists the values defined by the graph points that are available for use.