Administration Guide
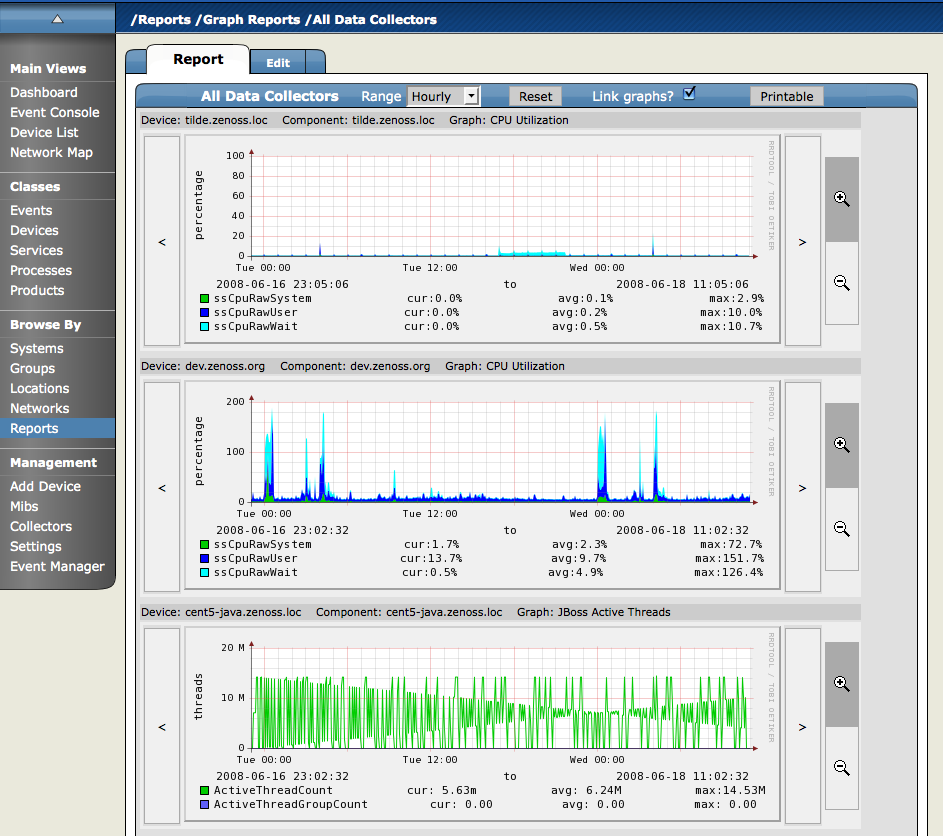
Graph Reports allow you to assemble graphs from specific Devices and Device Components into a single report. Click on Reports in the left navigation menu, then on the Graph Reports organizer to view or create Graph Reports. Graph Reports have a normal view which is similar to the graph views for Devices and Device Classes. Graph Reports also have a Printable view more appropriate for printing which can be brought up by clicking on the Printable button at the top of the report view.
Note that Graph Reports can only display graphs that already exist on Device or Components within Zenoss. You cannot define new graphs or alter existing graphs from within a Graph Report. If you need this type of functionality you probably want MultiGraph Reports instead.
From within the Graph Reports organizer or a sub-organizer use the Add Graph Report menu item to create a new report. After entering a name for the new report you will be taken to the edit page. The fields for a Graph Report are:
Name - The name of the report is displayed at the top of the report.
Title - This description is displayed in the list of reports for the report organizer. It is also available for use in the comments.
Number of Columns - This is the number of columns the graphs will be displayed in on the report.
Comments - The comments are displayed at the top of the Printable version of the report. This is a TALES evaluated string that may contain HTML formatting. The variables available to the TALES expression are now (the current date and time) and report (the report object itself.)
The Add New Graph section of the Edit page allows you to add one or more graphs to the report. The first step is to select one or more Devices. The list of Devices can be narrowed by entering a search string to the left of the Filter button and pressing Return or clicking the Filter Button. When you select one or more Devices the Component list will display the names of all Components defined on at least one of the selected Devices. The Graph list will list the Graphs available on one or more of the listed Devices. When one or more Components are selected the Graph list will display Graphs from the selected Components rather than the selected Devices.
At any point you may select one or more Graphs and use the Add Graph to Report button. Zenoss steps through each selected Component (if any are selected) or Device (if no Components are selected) looking for graphs with the given names. Matching graphs are added to the Graph Report.
Graph Reports maintain a static list of graphs which does not change when graphs are added or deleted from Performance Templates. For example, take DeviceA which has only one graph called Graph1 and DeviceB which has two graphs named Graph1 and Graph2. On the Graph Report edit page if you selected DeviceA and DeviceB the list of graphs would include Graph1 and Graph2. Selecting both graphs and clicking the Add Graph to Report button would add three graphs to the report: DeviceA's Graph1, DeviceB's Graph1 and DeviceB's Graph2. If at some later date you created a Graph2 on one of DeviceA's Performance Templates it would not automatically appear on the Graph Report, you would have to edit the report to specifically add it. Similarly, if one of the graphs was removed from DeviceB's Template (or if DeviceB was deleted from Zenoss) you would need to manually remove them from the Graph Report.
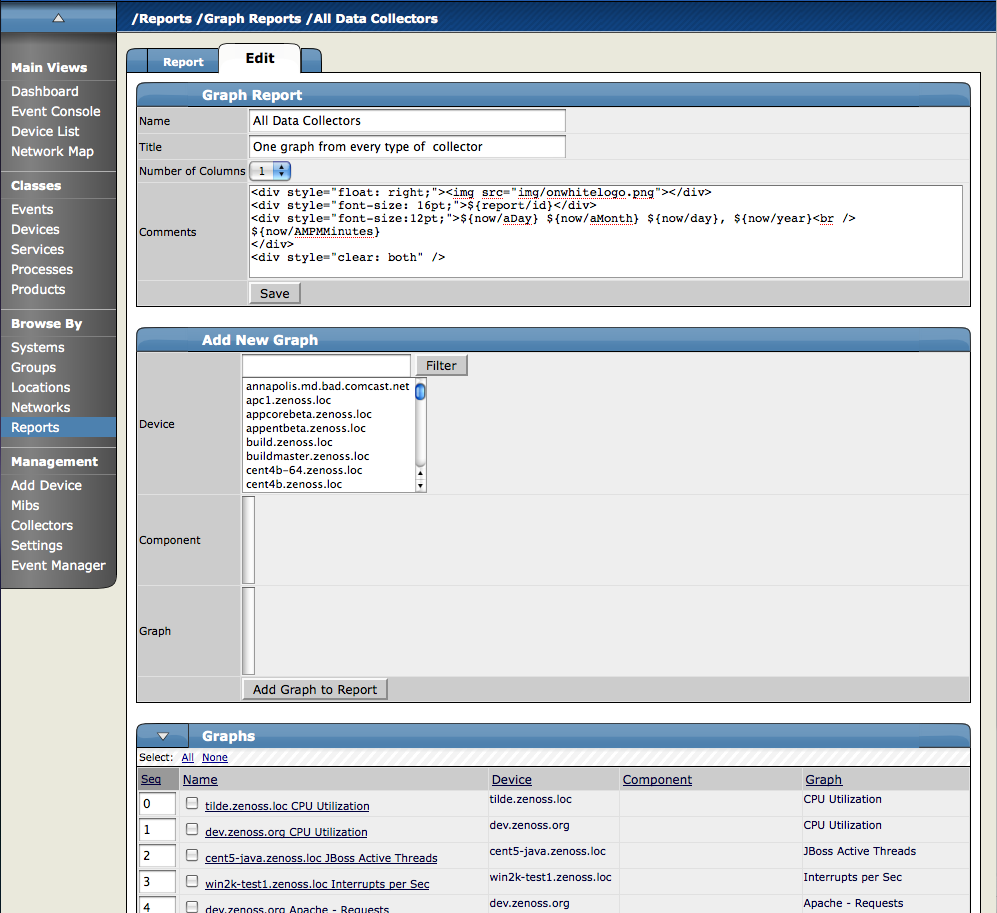
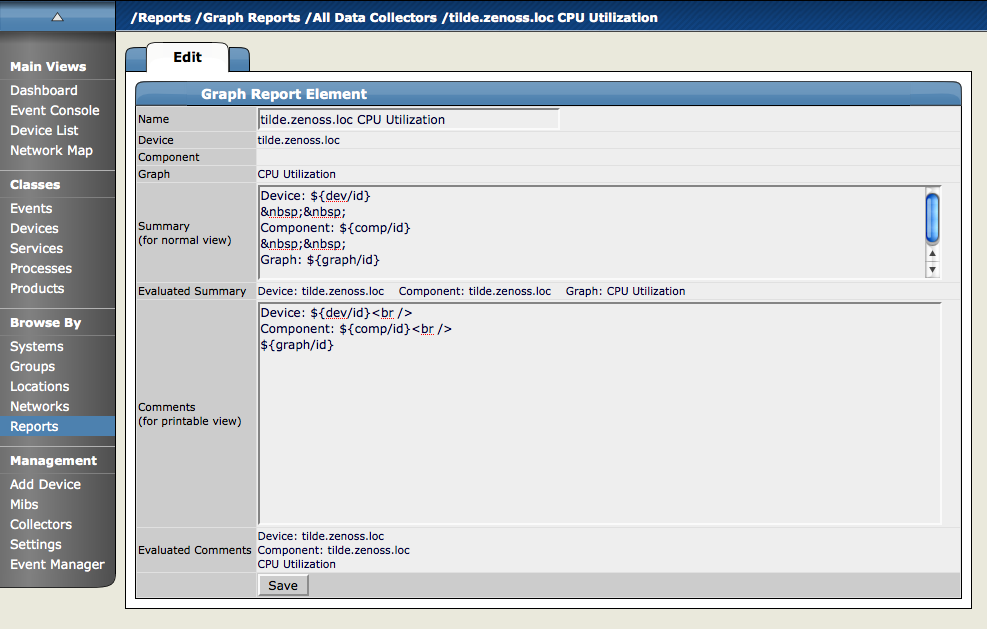
The Graphs section of the Edit page lists the graphs that are included in this report. Click the name of any of the graphs takes you to an edit page where you can edit the text that appears with the graph when the report is viewed. The Summary field is displayed above the graph in the normal report view and the Comments field is displayed to the left of the graph in the printable view. Both of these fields may contain TALES expressions with these variables: dev (the device), comp (the component) and graph (the graph.)
In both the normal and printed view of the report graphs are laid out from left to right in as many columns as specified on the report's edit page. For example, if a report has three columns then the first three graphs are placed on the first line of the report and the fourth graph would be the first one on the second row. By altering the sequence of the graphs on the edit page you can control where each graph appears on the report view. You change the sequence by editing the values in the Seq column beside each graph name and choosing the Re-sequence Graphs menu item.