Developer's Guide
For this section, we will contemplate a new collector that will collect ping performance data. We will want to create a new DataSource type with several built-in DataPoints, such as Average Ping Time, and Fastest Ping Time.
The following example is a simple network ping-performance collector. It relies on the availability of fping to perform the actual ping test.
class pingperf(RRDDaemon):
   initialServices = RRDDaemon.initialServices + [
       'ZenPacks.zenoss.PingPerf.PingConfig'
       ]
   configCycleInterval = 20*60
   pingCycleInterval = 5*60
The class pingperf is derived from a base class that supports writing to RRD files. It is a also PBDaemon, which means that it will connect to ZenHub to fetch its configs and post events. PingConfig is the module/class that will be loaded in ZenHub to satisfy zenperf's configuration requests. We also configure reasonable default values for two cycles: the time between configuration refreshes and the time between ping tests.
   def __init__(self):
       RRDDaemon.__init__(self, 'pingperf')
       self.devices = {}               # device id -> ip address
       self.running = False
The constructor for this class calls the base's constructor, passing our name. We will need to hold the configuration between cycles, so we initialize an empty configuration. If the ping testing takes longer than one configuration cycle, we won't want to start a second test. We set a flag to note that we aren't running a ping test (yet).
When the base class is started, it attempts to connect to ZenHub and get remote references to the services is will use. Most collectors have two services: EventService and a collector-specific service that scans the model for configuration. Our service will be PingConfig. After the service reference are loaded, the base class calls a connected() method.
   def connected(self):
       def inner(driver):
           log.debug("fetching config")
           yield self.fetchConfig()
           driver.next()
           driveLater(self.configCycleInterval, inner)
       drive(inner).addCallbacks(self.pingDevices, self.errorStop)
This method uses a technique to serialize a callback chain. See the ZenUtils/Driver.py for details on how this works. The effect is that the config is loaded with the fetchConfig() method, and the inner function is called repeatedly after configCycleInterval seconds.
Once the inner function completes the first time, it either calls pingDevices() on success or errorStop() on failure.
When the collector connects, and requests its config from the Service, the service will walk the list of all the devices for that monitor, and extract out the ping DataSources:
def remote_getDevices(self):
  config = []
  monitor = self.dmd.Monitors.Performance._getOb(self.name)
  for dev in self.monitor.devices():
    for templ in dev.getRRDTemplates():
      dataSources = templ.getRRDDataSources('Ping')
      if dataSources:
         break
  else:
    continue
  config.append(
    (dev.id,            # name of the device
     dev.getManageIp(), # the IP to ping
    dev.getThresholdInstances('Ping')
                        # any thresholds on the ping
     )
   )
To make this configuration load incremental, the Service can send just the name of the devices to load, and then the collector can use a different method to load the configuration of each device at a later time. For such a simple configuration, it may not be worth the extra complexity.
When this code is placed into a class that is a sub-class of HubService, it can be loaded by name, when the collector loads it services. PBDaemon will automatically connect you to this service, if the name of the service is provided in the class configuration.
The call to get this configuration in our new collector looks like this:
   d = self.getService('some.package.PingService').callRemote('getDevices')
   d.addCallback(self.startCollection)
Note
PBDaemonhas already connected you to the servicesome.package.PingServiceclass.getDevicesbecomesremote_getDevicesin the hub.The protocol for getting configurations is anything you like: you can control both sides of the communications.
Requests and responses are asynchronous and will involve callback objects.
The communications are heavily dependent on the Prospective Broker (PB) library in Twisted. Please refer to the Perspective Broker (PB) documentation for how the calls to remote objects work.
As each collector reads updated performance data it will evaluate any thresholds associated with those updates. The classes representing those thresholds must be loaded before the thresholds may loaded evaluated. So, each collector asks ZenHub for the names of all of the thresholds that can be monitored and imports them for future use.
The management of Thresholds within the collector is complex. There exists a class (Thresholds) to manage the thresholds and transform performance updates into events.
A complex threshold allows Zenoss to produce an event:
When user time and system time is over 80%
When value A is 80% of value B
On a different RRD consolidation function from
AVERAGEWhen a file system is X% full, and a critical event is Y% full
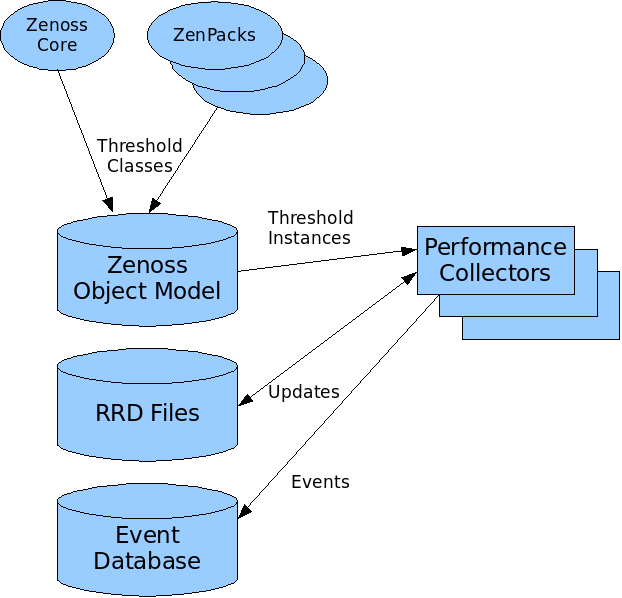
Thresholds are not “min/max value checkers” but “transformers of values into events”. As new values come in, the Threshold will look at the value and determine if an event is warranted. Because of the inheritable template mechanism, we have two separate tasks for Thresholds. The first is to represent the configuration for a threshold within the template. A value like “80” in the case of “File System at 80% full” is part of the configuration. However, when applied to a context, such as file system “C:\\” on device “WINXYZ” the value becomes “96000 blocks”. The value “96000 blocks” needs to transfer from the Zenoss object model, to the collector, so that values can be evaluated with the given context, without referring to the entire object model.
This leads us to separate thresholds into two components: one that hold the configuration and user intent, and another that can travel as part of the collector configuration to the collector. This “Threshold with Context” object is then executed when new values for data points are collected. The first type of threshold (for configuration) is called ThresholdClass, and the second type, which evaluates a value with context is called a ThresholdInstance. The Zenoss data model will load ThresholdClass classes from Zenoss and installed ZenPacks. These objects are responsible for creating the ThresholdInstance objects that are sent via the collector configuration for evaluation in the collector. Templates refer to derived versions of ThresholdClass, which when given a context, create ThresholdInstance objects.
To reduce the effort when writing a performance collector, support classes are used to hold ThresholdInstances and map updates to datapoints into threshold evaluation and event generation. The classes MinMaxThreshold and MinMaxThresholdInstance replaced the previous Threshold and flattening mechanism defined for data points and collectors in Zenoss version 2.0.X.
Presently, collectors are generally ignorant of context (device, or component), and almost certainly ignorant of DataSources and DataPoints. They are given the parameters necessary to fetch a value and store it into an RRD file. ThresholdsInstances wish to work on distinguished DataSource/DataPoint names within a context. So, to map from RRD files back to Thresholds, we use the RRD filename. When a collector updates a file, it notifies the Thresholds class (the utility class for all collectors to hold threshold information). This class maintains a mapping of file names to Threshold and DataPoint. Eventually, it might be worth translating the collectors so that they know about context and DataPoint.
Let's look at fetchConfig():
   def fetchConfig(self):
       'Get configuration values from ZenHub'
       def inner(driver):
           yield self.model().callRemote('getDefaultRRDCreateCommand')
           createCommand = driver.next()

           yield self.model().callRemote('propertyItems')
           self.setPropertyItems(driver.next())

           self.rrd = RRDUtil(createCommand, self.pingCycleInterval)

           yield self.model().callRemote('getThresholdClasses')
           self.remote_updateThresholdClasses(driver.next())

           yield self.model().callRemote('getCollectorThresholds')
           self.rrdStats.config(self.options.monitor,
                                self.name,
                                driver.next(),
                                createCommand)

           devices = []
           if self.options.device:
               devices = [self.options.device]
           yield self.model().callRemote('getDevices', devices)
           update = driver.next()
           if not isinstance(update, dict):
               log.error("getDevices returned: %r" % update)
           else:
               self.devices = update
       return drive(inner)
Here the same drive/inner technique is used to serialize a bunch of asynchronous remote method calls. The base class provides a method called model() which returns a remote reference to the collector-specific configuration class. We call several remote methods, most of which are inherited from a base ZenHub service class.
We must get the default RRD create command. Then we copy the collector properties, which provides updated values for pingCycleInterval and configCycleInterval. In order to execute thresholds, we need to know the set of all threshold classes and get them imported. After the threshold classes are installed, we have to get the thresholds for this collector. These thresholds do not belong to the datapoints to be collected (ping response time), but for values like "total cycle time" that are based on the collectors performance.
Finally we call the remote method getDevices() which returns a mapping of device id to IP address. We make allowances for the simple one-device invocation:
pingperf -v 10 -d someDevice
Here's our ZenHub service:
from Products.ZenHub.services.PerformanceConfig import PerformanceConfig
class PingConfig(PerformanceConfig):
    """
    A very simple service for fetching device data
    """

    def getDeviceConfig(self, device):
        return (device.id, device.getManageIp())

    def sendDeviceConfig(self, listener, config):
        listener.callRemote('updateDevice', config)

    def remote_getDevices(self, devices):
        result = {}
        for d in self.config.getDevices():
            if not devices or d.id in devices:
                result[d.id] = d.getManageIp()
        return result
Most of the implementation for this class is in the base class. The base class determines the devices affected when database changes occur. It then uses the methods getDeviceConfig and sendDeviceConfig to figure out how to send the changes to the collector.
Back to the collector, here are the methods that are called by ZenHub to update the collector with changes:
   def remote_deleteDevice(self, doomed):
       log.debug("Async delete device %s" % doomed)
       try:
           del self.devices[doomed]
       except KeyError:
           pass

   def remote_updateDevice(self, cfg):
       log.debug("Async config update for %s", cfg.name)
       d, ip = cfg
self.devices[d] = ipThe only method left in our simple collector is to actually ping some devices, post the timings to a configuration file, send any resulting events, and send a heartbeat.
    def pingDevices(self, ignored=None):
       def inner(driver):
           reactor.callLater(self.configCycleInterval, self.pingDevices)
           if not self.options.cycle:
               self.stop()
           if self.running:
               log.error("Ping is still running")
               return
           self.running = True

           log.debug("Pinging %s..." % (" ".join(self.devices.keys())[:100]))
           start = time.time()
           revMap = dict([(ip, d) for d, ip in self.devices.items()])
           fd, fname = mkstemp()
           fp = os.fdopen(fd, "w")
           log.debug("Writing devices to tempfile %s." % fname)
           fp.write('\n'.join(revMap.keys()) + '\n')
           fp.close()
           from twisted.internet.utils import getProcessOutput
           fping = os.path.join(os.path.dirname(__file__), "fping.sh")
           log.debug("starting %s" % fping)
           yield getProcessOutput(fping, (fname,))
           log.debug("fping returned: %s" % driver.next())
           for line in driver.next().split('\n'):
               if not line: continue
               match = parseLine.match(line)
               if not match:
                   log.debug("%s does not match expected output" % line)
                   continue
               ip = match.group(IP)
               ms = float(match.group(MS))
               if not revMap.has_key(ip):
                   continue
               device = revMap.pop(ip)
               path = 'Devices/%s/ping_time' % device
               ms = self.rrd.save(path, ms, 'GAUGE')
               for ev in self.thresholds.check(path, time.time(), ms):
                   self.sendThresholdEvent(**ev)
           os.unlink(fname)
           self.heartbeat()
           cycle = self.pingCycleInterval
           self.rrdStats.gauge('devices', cycle, len(self.devices))
           self.rrdStats.gauge('down', cycle, len(revMap))
           self.rrdStats.gauge('cycleTime', cycle, time.time() - start)

       d = drive(inner)
       def clearRunning(arg):
           self.running = False
           if isinstance(arg, Failure):
               log.error("Error pinging devices: %s" % (arg,))
           return arg
       d.addBoth(clearRunning)
       return d
This is a long method, so let's take it in parts. Let's take everything outside of the inner() function:
def inner():
    # ....

       d = drive(inner)
       def clearRunning(arg):
           self.running = False
           if isinstance(arg, Failure):
               msg = "Error occurred in pingperf collection: %s" % (arg.value,)
               self.sendEvent(WARNING_EVENT, summary=msg)
           return arg
       self.running = True
       d.addBoth(clearRunning)
       return d
Again we are using the same drive/inner approach to serialize asynchronous calls. We also want to track the fact that we are running the inner method so that we can detect cases where our collection cycle is taking too long. The clearRunning() function is added to the callback chain to ensure that the running flag is reset however the inner function completes. It was also a convenient place to report on any errors. Here's the definition of WARNING_EVENT to remove any mystery about its value:
The following is a constant definition used to send an event if the collector has an error:
WARNING_EVENT = dict(eventClass=Status_Ping,
                    component="ping",
                    device=socket.getfqdn(),
                    severity=Warning)
The inner function does all the work:
       def inner(driver):
           reactor.callLater(self.configCycleInterval, self.pingDevices)
           if not self.options.cycle:
               self.stop()
           if self.running:
               log.error("Ping is still running")
               return
This bit of code controls the ping cycle. By starting the timer call chain immediately we are ensured to repeat the call in the future even if an error occurs or the collection takes too long.
           log.debug("Pinging %s..." % (" ".join(self.devices.keys())[:100]))
           start = time.time()
           revMap = dict([(ip, d) for d, ip in self.devices.items()])
           fd, fname = mkstemp()
           fp = os.fdopen(fd, "w")
           log.debug("Writing devices to tempfile %s." % fname)
           fp.write('\n'.join(revMap.keys()) + '\n')
           fp.close()
Our implementation for pinging all the devices is farmed out to an external process (fping). So we write a config file for fping (a list of IP addresses) into a temporary file. Next, we run fping and collect the results:
           from twisted.internet.utils import getProcessOutput
           fping = os.path.join(os.path.dirname(__file__), "fping.sh")
           log.debug("starting %s" % fping)
           yield getProcessOutput(fping, (fname,))
           log.debug("fping returned: %s" % driver.next())
The next loop parses each line of output using a regular expression:
           log.debug("fping returned: %s" % driver.next())
           for line in driver.next().split('\n'):
               if not line: continue
               match = parseLine.match(line)
               if not match:
                   log.debug("%s does not match expected output" % line)
                   continue
               ip = match.group(IP)
               ms = float(match.group(MS))
               if not revMap.has_key(ip):
                   continue
When a match is found, we determine the device from the IP address and post the value to an RRD file:
               device = revMap.pop(ip)
               path = 'Devices/%s/ping_time' % device
               ms = self.rrd.save(path, ms, 'GAUGE')
We use the resulting value (which may have been averaged in with other data from the RRD file) to check thresholds:
               for ev in self.thresholds.check(path, time.time(), ms):
                   self.sendThresholdEvent(**ev)
Finally, we remove the temporary file, send a heartbeat, and report statistics on the total number of devices, the devices that did not report, and the total time to process the device list.
           os.unlink(fname)
           self.heartbeat()
           cycle = self.pingCycleInterval
           self.rrdStats.gauge('devices', cycle, len(self.devices))
           self.rrdStats.gauge('down', cycle, len(revMap))
           self.rrdStats.gauge('cycleTime', cycle, time.time() - start)