Extended Monitoring Guide
JConsole is a tool built into the JDK that allows system administrators to query a JMX Agent and examine the MBeans deployed within the server. JConsole also allows administrators to view JVM summary information, including the amount of time the JVM has been running, how many threads are active, how much memory is currently used by the heap, how many classes are currently loaded, and how much physical memory exists on the machine.
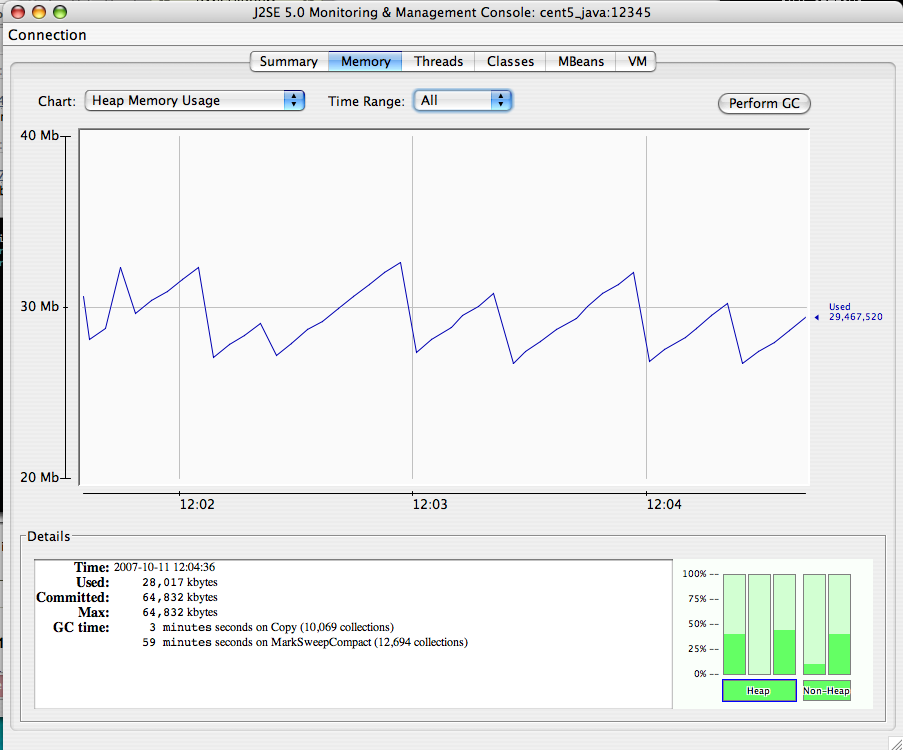
JConsole also provides a graph that shows memory, thread, and class usage over time. The scale of the graph can be adjusted so that a system administrator can examine a specific period of time, or can zoom out to view a longer range picture of usage. Unfortunately, JConsole can only produce graphs that show usage while JConsole was running. Administrators cannot look back in time to a point where the JVM was running but JConsole was not monitoring the JVM.
The MBeans tab along the top of JConsole provides an interactive method for examining MBean values. After clicking on the MBeans tab a panel will be displayed with a tree on the left hand side. The tree contains a hierarchical list of all MBeans deployed in the JVM.
The standard JVM MBeans are all in the java.lang and java.util.logging packages. Application server specific MBeans do not follow any standard naming pattern. Some vendors choose to use package names for their MBean names while other vendors choose package-like names (but not fully qualified packages).
To get started expand the java.lang node in the Tree. This will expose several MBeans as well as additional folders. Click on the Memory MBean and observe how the right hand side of the panel is populated with information about the Memory MBean.
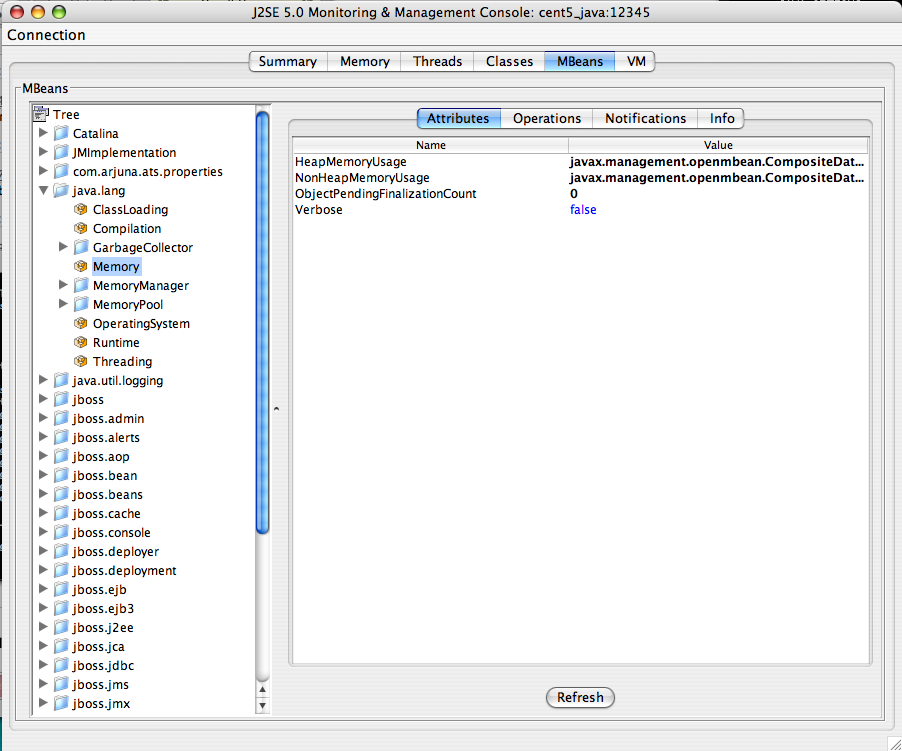
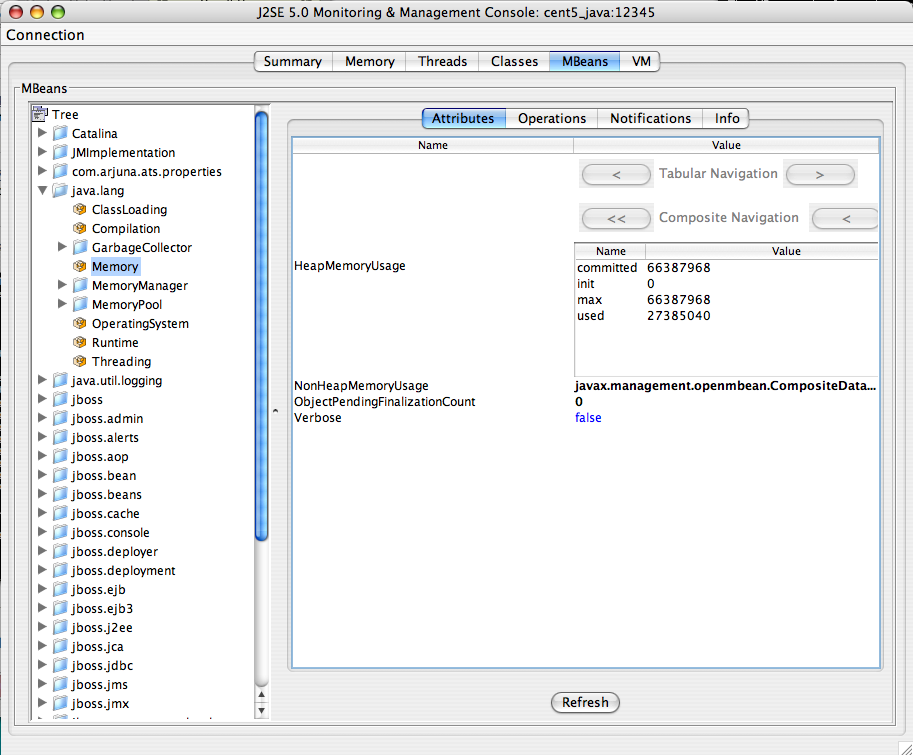
MBeans can contain attributes and operations. MBeans can also fire notifications to observers, but that's beyond the scope of this document. The attributes tab lists all of the attributes in the first column and their values (or a clickable attribute type) in the second column. In the case of Memory the HeapMemoryUsage is a Composite attribute, otherwise referred to as a "complex-value attribute" in Zenoss. Double click the "javax.management.openmbean.CompositeDataSupport" type and you will see multiple attributes appear. The show the amount of committed, maximum, and used memory sizes for the heap.
The unique name of the MBean can be viewed by clicking on the Info tab. The first value is MBean Name and it's value in the case of Memory is: "java.lang:type=Memory". Note that there isn't a standardized way to name MBeans and application server vendors do it differently.
You can also examine operation information by clicking on the Operations tab. These are methods that JConsole can remotely invoke on an MBean that will result in some value being computed or some state changing in the application. The Threading MBean has several operations that can be invoked that return information. Click on the java.lang package and then click on the Threading operation. Lastly, click on the Operations tab. Methods like "getThreadUserTime" are invocable.
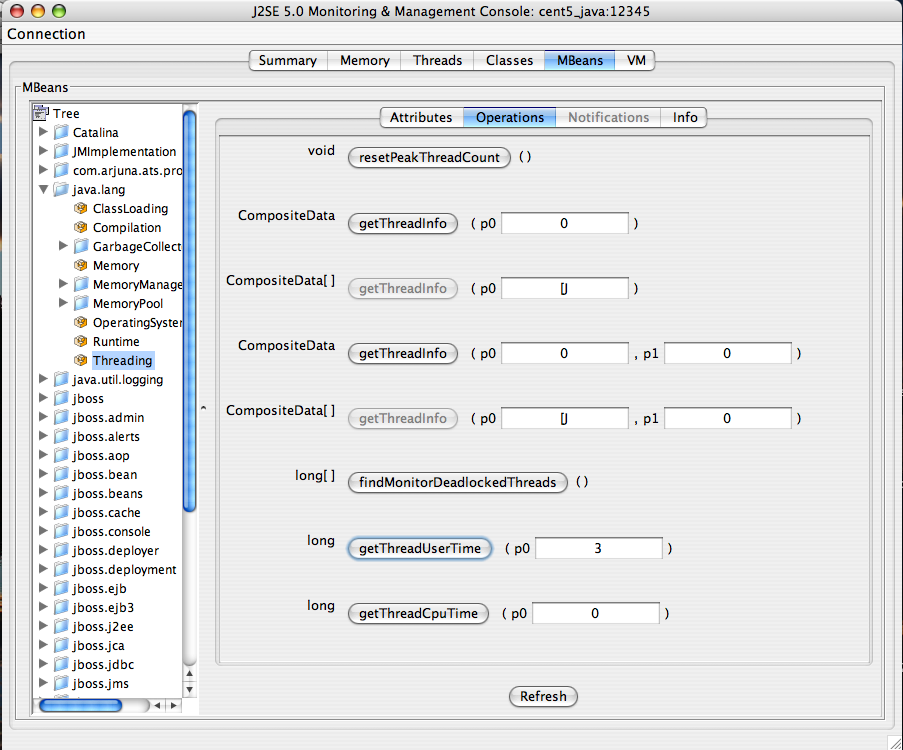
Test the "getThreadUserTime" method by changing the p0 parameter to 1 and clicking the "getThreadUserTime" button. A dialog window will be raised that displays the amount of CPU user time thread #1 has used. Try adjusting the parameter to different values to observe the different CPU times for the threads.