A chart is used to show a set of data as a graph. It helps users to judge things with a snapshot. To use a chart component , developers must prepare a ChartModel and a ChartEngine. Developers also set proper chart type, and the threeD (3D) attribute to draw proper chart. The model and type must match to each other; or the result is unpredictable. The 3D chart is not supported on all chart type.
|
Type |
Model |
3D |
|---|---|---|
|
|
|
|
|
|
|
|
|
|
|
|
|
|
|
|
|
|
|
|
|
|
|
|
|
|
|
|
|
|
|
|
|
|
|
x |
|
|
|
x |
|
|
|
x |
|
|
|
x |
|
|
|
x |
|
|
|
x |
|
|
|
x |
|
|
|
x |
|
|
|
x |
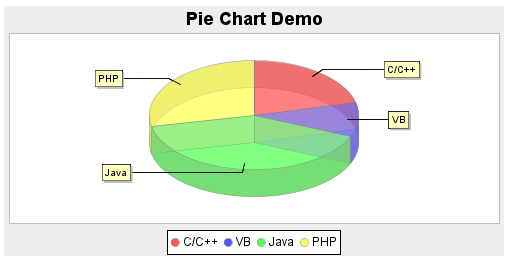
<vbox>
<chart id="mychart" title="Pie Chart Demo" width="500" height="250" type="pie" threeD="true" fgAlpha="128"/>
<zscript>
PieModel model = new MyPieModel();
mychart.setModel(model);
</zscript>
</vbox>
|
Name |
Event Type |
|---|---|
|
|
|
|
Property |
Description |
Data Type |
Default Value |
|---|---|---|---|
|
|
Sets the background alpha (transparency, 0 ~ 255). |
|
|
|
|
Sets the background color of the chart.It must be in |
|
|
|
|
Sets the foreground alpha (transparency, 0 ~ 255). |
|
|
|
|
Sets height of chart, it must be a integer string |
|
|
|
|
Sets the chart orientation. Values: |
|
|
|
|
Sets the pane alpha (transparency, 0 ~ 255). |
|
|
|
|
Sets the pane color of the chart.It must be |
|
|
|
|
Sets the period used in Time Series Chart. Values : millisecond | second | minute | | hour | day | week | month | quarter | year |
|
|
|
|
Sets the flag of showing the chart's legend |
|
|
|
|
Sets the flag of showing the chart's tool tip text |
|
|
|
|
Sets true to show three dimensional graph (If a type of chart got no 3d peer, this is ignored). |
|
|
|
|
Sets the chart's title. |
|
|
|
|
Set the chart's type Values: |
|
|
|
|
Sets width of chart, it must be a integer string |
|
|
|
|
Sets the label in xAxis. |
|
|
|
|
Sets the label in yAxis. |
|
|
|
Name |
Description |
Return Data Type |
|---|---|---|
|
|
Returns the renderer to render each area, or null if the default renderer is used. |
|
|
|
Get the background color in int array (0: red, 1: green, 2:blue). |
|
|
|
Returns the implemetation chart engine. |
|
|
|
Get the chart int width in pixel |
|
|
|
Get the chart int width in pixel |
|
|
|
Returns the chart model associated with this chart, or null if this chart is not associated with any chart data model |
|
|
|
Get the pane color in int array (0: red, 1: green, 2:blue). |
|
|
|
Returns the time zone that this Time Series Chart belongs to, or null if the default time zone is used. |
|
|
|
Instantiates the default chart engine |
|
|
|
Sets the renderer which is used to render each area |
|
|
|
Sets the chart engine |
|
|
|
Sets the chart model associated with this chart |
|
|
|
Sets the time zone that this Time Series Chart belongs to, or null if the default time zone is used |
|
|
|
mark a draw flag to inform that this Chart needs update |
|