Scilab Home page | Wiki | Bug tracker | Forge | Mailing list archives | ATOMS | File exchange
Please login or create an account
Change language to: Français - Português - Русский - 日本語
Scilab Help >> Control Systems - CACSD > Linear Analysis > Frequency Domain > gainplot
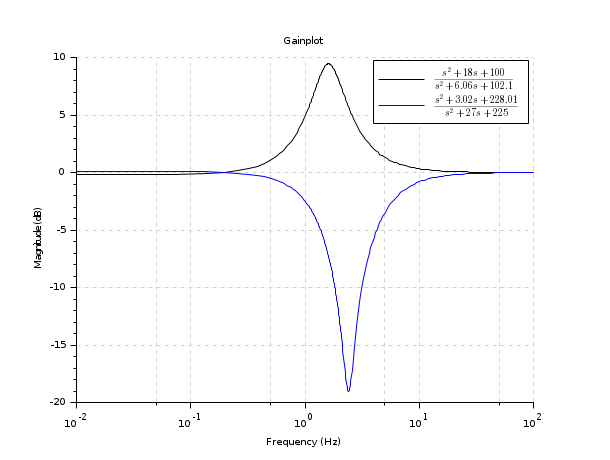
gainplot

magnitude plot

Syntax

gainplot(sl,fmin,fmax [,step] [,comments] )
gainplot(frq,db,phi [,comments])
gainplot(frq, repf [,comments])

Arguments

sl

list (syslin SIMO linear system).

fmin,fmax

real scalars (frequency interval).

step

real (discretization step (logarithmic scale))

comments

string

frq

matrix (row by row frequencies)

db,phi

matrices (magnitudes and phases corresponding to frq)

repf

complex matrix. One row for each frequency response.

Description

Same as bode but plots only the magnitude.

Examples

s=poly(0,'s')
h1=syslin('c',(s^2+2*0.9*10*s+100)/(s^2+2*0.3*10.1*s+102.01))
h2=syslin('c',(s^2+2*0.1*15.1*s+228.01)/(s^2+2*0.9*15*s+225))
clf();gainplot([h1;h2],0.01,100,..
                   ["$\frac{s^2+18 s+100}{s^2+6.06 s+102.1}$";
                    "$\frac{s^2+3.02 s+228.01}{s^2+27 s+225}$"])
title('Gainplot')

See Also

  • bode — Bode plot
  • black — Black-Nichols diagram of a linear dynamical system
  • nyquist — nyquist plot
  • repfreq — frequency response
  • g_margin — gain margin and associated crossover frequency
  • datatips — Tool for placing and editing tips along the plotted curves.
Scilab Enterprises
Copyright (c) 2011-2015 (Scilab Enterprises)
Copyright (c) 1989-2012 (INRIA)
Copyright (c) 1989-2007 (ENPC)
with contributors
Last updated:
Wed Jun 15 08:27:35 CEST 2016