
|
| Home > Apache Geronimo v1.0 > Documentation > Apache Geronimo v1.0 - User's Guide > Administration > Geronimo Administration Console |
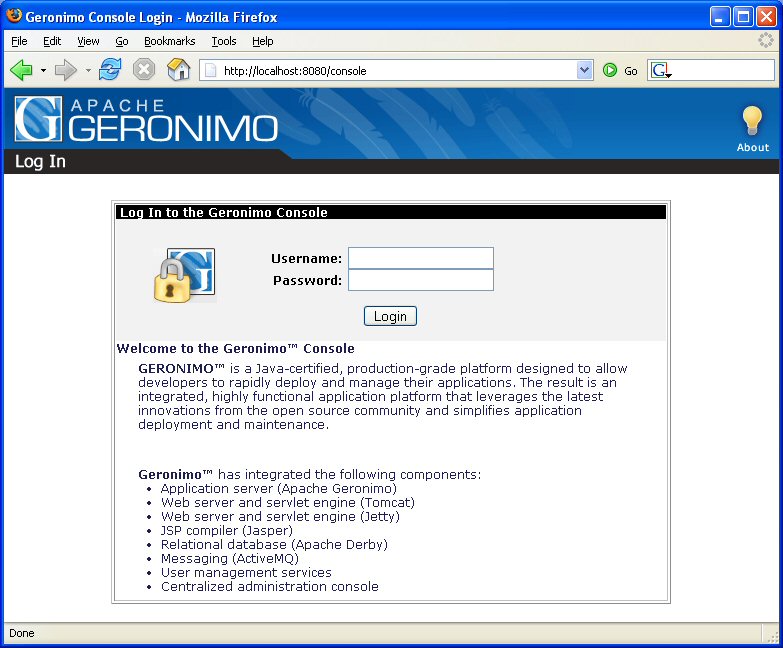
The Geronimo Administration Console is a Web based interface that provides a convenient, user friendly way to administer many aspects of the Geronimo Server. Once you have the Apache Geronimo server started (see Tools and commands) you can access the Administration Console by pointing your browser to the following URL:
The Administration Console log in page is depicted in the following figure.

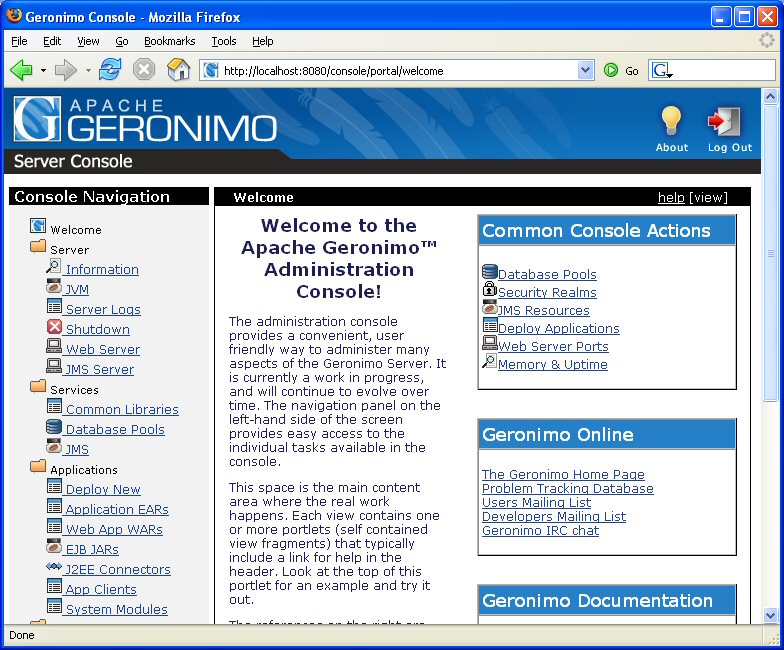
Log in by specifying system as the username and manager as the password. Once you are logged in you will be redirected to the console's welcome page. The console has two main areas, a navigation panel on the left and a main content area on the right.
The navigation panel on the left provides easy access to the individual tasks, it is always present and allows easy transition from task to task. The main content area on the right is where the real work happens, this area will change as you select the different tasks in the navigation panel on the left. Each view contains one or more portlets that typically include a link for help in the header, see the following figure as an example.

As briefly explained in the previous section, the navigation panel provides access to the different tasks for administering the resources in Geronimo. This navigation panel is organized in the following main groups:
 Welcome
 Server
 Services
 Applications
 Security
 Misc
Misc
This is the welcome page you see when you log in. It provides a gerenal description of what the Geronimo Administration Console is as well as some shortcut links to common tasks such as:
 Database Pools
 Security Realms
 JMS Resources
 Deploy Applications
 Web Server Ports
 Memory & Uptime
This page also provide links to:
Organized under the Server group you will find statistical information as well as links for configuring and administering the different servers. This group is organized as follows:
 Information
 JVM
JVM
 Server Logs
 Shutdown
 Web Server
 JMS Server
This portlet displays the server's uptime and the resources being used by the JVM.
This portlet displays the values of the system properties available to the server process.
This option provides four portlets, Log Manager, Server Log Viewer, Derby Log Viewer and Web Access Log Viewer.
This portlet allows a warm reboot of the server or a shutdown of it. A warm reboot will shutdown all applications and services and reboot the Geronimo kernel within the same process. The Administration Console session will be disconnected. Reconnect after the server is back up.
A shutdown will shutdown the server and cause the JVM to exit. To continue using the Geronimo Console after a shutdown, Geronimo must be restarted.
This option provides two portlets, Web Server Manager and Network Listeners.
|
For the last five values, Count, Average and Maximum will be also displayed. |
This option provides two portlets, JMS Server Manager and JMS Network Listeners.
Organized under this group you will find links for configuring the following services:
 Common Libraries
 Database Pools
 JMS
JMS
This portlet displays the artifacts installed in the server's repository. The layout of the repository is the same as that used by Apache Maven making it possible to easily copy files over. From this portlet you can also install new artifacts.
This portlet displays all the available database pools and their status. Only server-wide database pools can be edited in this portlet, database pools deployed as part of a single application cannot, you will have to change the deployment plan in the application instead.
From this portlet you can edit the available, system-wide, database pools. There is also a usage link with examples of how to use the pool from your application.
This portlet includes a database pool creation wizard for new pools and also lets you import database pools from JBoss 4 and WebLogic 8.1.
This option provides two portlets, JMS Connection Factories and JMS Destination Manager.
Organized under this group you will find links for installing and administering applications.
 Deploy New
 Application EARs
 Web App WARs
 EJB JARs
 J2EE Connectors
 App Clients
 System Modules
This portlet allows you to deploy new applications on the Geronimo server. Web applications require deployment plans, which are either packaged with the war file or kept in a separate file which is typically called geronimo-web.xml.
This portlet displays the installed Application EARs and their status. From this portlet you can also stop, start and uninstall the available Application EARs.
This portlet displays the installed Web Applications and their status. From this portlet you can also stop, start and uninstall the available Web Applications.
This portlet displays the installed EJB JARs and their status. From this portlet you can also stop, start and uninstall the available EJB JARs.
This portlet displays the installed J2EE Connectors and their status. From this portlet you can also stop, start and uninstall the available J2EE Connectors.
This portlet displays the installed Application Clients and their status. From this portlet you can also stop, start and uninstall the available Application Clients.
This portlet displays the installed System Modules and their status. From this portlet you can also stop, start and uninstall the available System Modules.
 Console Realm
 Security Realm
 Keystore
This option provides two portlets, Console Realm Users and Console Realm Groups.
This portlet displays all available security realms and their status. Only server-wide security realms can be edited in this portlet, security realms deployed as part of a single application cannot, you will have to change the deployment plan in the application instead.
From this portlet you can edit the available, system-wide, security realms. There is also a usage link with examples of how to use the realm from your application.
This portlet also includes a security realm creation wizard for creating new realms.
This portlet displays the certificates installed, lets you import trusted certificates and generate a key pair.
At this point this group has only one entry and is for administering the embedded database. The breakdown of this group is as follows.
This portlet displays information about the internal database, such as:
This option provides two portlets, DB VIewer and Run SQL.