Quickstart
This section provides a basic guide for deploying a Kafka cluster along with all Confluent Platform components in your Docker environment. By the end of this quickstart, you will have a functional Confluent deployment against which you can run any number of applications.
In order to keep things simple, we’ll start with a single node Docker environment. Details on more complex target environments are available later in this documentation (More Tutorials). We will also be configuring Kafka and Zookeeper to store data locally in their Docker containers. You should refer to our documentation on Docker external volumes for examples of how to add mounted volumes to your host machines. Mounted volumes provide a persistent storage layer for deployed containers, which allows images such as cp-kafka and cp-zookeeper to be stopped and restarted without losing their stateful data.
Installing & Running Docker
For this tutorial, we’ll run Docker using the Docker client. If you are interested in information on using Docker Compose to run the images, we have docs for that too.
To get started, you’ll need to first install Docker and get it running. The CP Docker Images require Docker version 1.11 or greater.
Running Confluent Platform on Docker
If you’re running on Windows or Mac OS X, you’ll need to use Docker Machine to start the Docker host. Docker runs natively on Linux, so the Docker host will be your local machine if you go that route. If you are running on Mac or Windows, be sure to allocate at least 4 GB of ram to the Docker Machine.
After installing Docker as described in the previous section, we can create a Docker machine and begin starting up Confluent Platform.
Note
The following steps show each Docker container being launched in detached mode. We’ll be sure to show you how access the logs for those detached containers. If you prefer to run the containers in the foreground, you can do so by replacing the
-d(“detached”) flag with--it(“interactive”). Containers launched in interactive mode will stream the log messages for the Confluent service directly to the terminal window. For that reason, you’ll need a separate terminal for each Docker image launched in interactive mode.
Create and configure the Docker Machine. This example creates a VirtualBox VM with ~6GB of memory to serve as our Docker host.
docker-machine create --driver virtualbox --virtualbox-memory 6000 confluent
Next, configure your terminal window to attach it to your new Docker Machine:
eval $(docker-machine env confluent)
All of the subsequent commands should be run from that terminal window to ensure proper access to the running Docker host. To execute Docker commands from a new terminal window, simply execute the eval $(docker-machine env confluent) first.
Zookeeper
Start Zookeeper. You’ll need to keep this service running throughout, so use a dedicated terminal window if you plan to launch the image in the foreground.
docker run -d \
    --net=host \
    --name=zookeeper \
    -e ZOOKEEPER_CLIENT_PORT=32181 \
    confluentinc/cp-zookeeper:3.1.2
This command instructs Docker to launch an instance of the
confluentinc/cp-zookeeper:3.1.2container and name itzookeeper. We also specify that we want to use host networking and pass in the required parameter for running Zookeeper:ZOOKEEPER_CLIENT_PORT. For a full list of the available configuration options and more details on passing environment variables into Docker containers, see the configuration reference docs.We’ll check the Docker logs to confirm that the container has booted up successfully and started the Zookeeper service. The command to do that is:
docker logs zookeeperWith this command, we’re referencing the container name we want to see the logs for. To list all containers (running or failed), you can always run
docker ps -a. This is especially useful when running in detached mode.When you output the logs for Zookeeper, you should see the following message at the end of the log output:
[2016-07-24 05:15:35,453] INFO binding to port 0.0.0.0/0.0.0.0:32181 (org.apache.zookeeper.server.NIOServerCnxnFactory)Note that the message shows the Zookeeper service listening at the port we passed in as
ZOOKEEPER_CLIENT_PORTabove.If the service is not running, the log messages should provide details to help you identify the problem. Some common errors include:
- Network port already in use. In that case, you’ll see a message indicating that the Zookeeper service could not bind to the selcted port. Simply change to an open port or identify (and stop) the Docker container that has a service using that port.
- Insufficient resources. In rare occasions, you may see memory allocation or other low-level failures at startup. This will only happen if you dramatically overload the capacity of your Docker host.
Kafka
Start Kafka.
docker run -d \
    --net=host \
    --name=kafka \
    -e KAFKA_ZOOKEEPER_CONNECT=localhost:32181 \
    -e KAFKA_ADVERTISED_LISTENERS=PLAINTEXT://localhost:29092 \
    confluentinc/cp-kafka:3.1.2
Note
You’ll notice that we set the
KAFKA_ADVERTISED_LISTENERSvariable tolocalhost:29092. This will make Kafka accessible from outside the container by advertising it’s location on the Docker host. We also passed in the zookeeper port we used when launching that container a moment ago. Because we are using--net=host, the hostname for the zookeeper service can be left atlocalhost.Let’s check the logs to see the broker has booted up successfully:
docker logs kafkaYou should see the following at the end of the log output:
....
[2016-07-15 23:31:00,295] INFO [Kafka Server 1], started (kafka.server.KafkaServer)
[2016-07-15 23:31:00,295] INFO [Kafka Server 1], started (kafka.server.KafkaServer)
...
...
[2016-07-15 23:31:00,349] INFO [Controller 1]: New broker startup callback for 1 (kafka.controller.KafkaController)
[2016-07-15 23:31:00,349] INFO [Controller 1]: New broker startup callback for 1 (kafka.controller.KafkaController)
[2016-07-15 23:31:00,350] INFO [Controller-1-to-broker-1-send-thread], Starting  (kafka.controller.RequestSendThread)
...
Now we can take this very basic deployment for a test drive. We’ll verify that the broker is functioning normally by creating a topic and producing data to it. We’ll use the client tools directly from another Docker container.
First, we’ll create a topic. We’ll name it
fooand keep things simple by just giving it one partition and only one replica. Production environments with more broker nodes would obviously use higher values for both partitions and replicas for scalability and resiliency.docker run \ --net=host \ --rm confluentinc/cp-kafka:3.1.2 \ kafka-topics --create --topic foo --partitions 1 --replication-factor 1 --if-not-exists --zookeeper localhost:32181You should see the following output in your terminal window:
Created topic "foo".Before moving on, verify that the topic was created successfully:
docker run \
  --net=host \
  --rm \
  confluentinc/cp-kafka:3.1.2 \
  kafka-topics --describe --topic foo --zookeeper localhost:32181
The response should be:
Topic:foo   PartitionCount:1    ReplicationFactor:1 Configs:
Topic: foo  Partition: 0    Leader: 1001    Replicas: 1001  Isr: 1001
Next, we’ll publish some data to our new topic:
docker run \
  --net=host \
  --rm \
  confluentinc/cp-kafka:3.1.2 \
  bash -c "seq 42 | kafka-console-producer --request-required-acks 1 --broker-list localhost:29092 --topic foo && echo 'Produced 42 messages.'"
This command will use the built-in Kafka Console Producer to produce 42 simple messages to the topic. Upon running it, you should see the following:
Produced 42 messages.To complete the story, let’s read back the message using the built-in Console consumer:
docker run \
  --net=host \
  --rm \
  confluentinc/cp-kafka:3.1.2 \
  kafka-console-consumer --bootstrap-server localhost:29092 --topic foo --new-consumer --from-beginning --max-messages 42
If everything is working as expected, each of the original messages we produced should be written back out:
1
....
42
Processed a total of 42 messages
Schema Registry
Now that we have Kafka and Zookeeper up and running, we can deploy some of the other components included in Confluent Platform. We’ll start by using the Schema Registry to create a new schema and send some Avro data to a Kafka topic. Although you would normally do this from one of your applications, we’ll use a utility provided with Schema Registry to send the data without having to write any code.
First, let’s fire up the Schema Registry container:
docker run -d \
  --net=host \
  --name=schema-registry \
  -e SCHEMA_REGISTRY_KAFKASTORE_CONNECTION_URL=localhost:32181 \
  -e SCHEMA_REGISTRY_HOST_NAME=localhost \
  -e SCHEMA_REGISTRY_LISTENERS=http://localhost:8081 \
  confluentinc/cp-schema-registry:3.1.2
As we did before, we can check that it started correctly by viewing the logs.
docker logs schema-registryFor the next step, we’ll publish data to a new topic that will leverage the Schema Registry. For the sake of simplicity, we’ll launch a second Schema Registry container in interactive mode, and then execute our
kafka-avro-console-producerutility from there.docker run -it --net=host --rm confluentinc/cp-schema-registry:3.1.2 bashDirect the utility at the local Kafka cluster, tell it to write to the topic
bar, read each line of input as an Avro message, validate the schema against the Schema Registry at the specified URL, and finally indicate the format of the data./usr/bin/kafka-avro-console-producer \ --broker-list localhost:29092 --topic bar \ --property value.schema='{"type":"record","name":"myrecord","fields":[{"name":"f1","type":"string"}]}'Once started, the process will wait for you to enter messages, one per line, and will send them immediately when you hit the
Enterkey. Try entering a few messages:{"f1": "value1"} {"f1": "value2"} {"f1": "value3"}Note
If you hit
Enterwith an empty line, it will be interpreted as a null value and cause an error. You can simply start the console producer again to continue sending messages.When you’re done, use
Ctrl+CorCtrl+Dto stop the producer client. You can then typeexitto leave the container altogether. Now that we’ve written avro data to Kafka, we should check that the data was actually produced as expected to consume it. Although the Schema Registry also ships with a built-in console consumer utility, we’ll instead demonstrate how to read it from outside the container on our local machine via the REST Proxy. The REST Proxy depends on the Schema Registry when producing/consuming avro data, so we’ll need to pass in the details for the detached Schema Registry container we launched above.
REST Proxy
This section describes how to deploy the REST Proxy container and then consume data from the Confluent REST Proxy service.
First, start up the REST Proxy:
docker run -d \
  --net=host \
  --name=kafka-rest \
  -e KAFKA_REST_ZOOKEEPER_CONNECT=localhost:32181 \
  -e KAFKA_REST_LISTENERS=http://localhost:8082 \
  -e KAFKA_REST_SCHEMA_REGISTRY_URL=http://localhost:8081 \
  -e KAFKA_REST_HOST_NAME=localhost \
  confluentinc/cp-kafka-rest:3.1.2
For the next two steps, we’re going to use CURL commands to talk to the REST Proxy. Our deployment steps thus far have ensured that both the REST Proxy container and the Schema Registry container are accessible directly through network ports on our local host. The REST Proxy service is listening at http://localhost:8082 As above, we’ll launch a new Docker container from which to execute our commands:
docker run -it --net=host --rm confluentinc/cp-schema-registry:3.1.2 bashThe first step in consuming data via the REST Proxy is to create a consumer instance.
curl -X POST -H "Content-Type: application/vnd.kafka.v1+json" \
  --data '{"name": "my_consumer_instance", "format": "avro", "auto.offset.reset": "smallest"}' \
  http://localhost:8082/consumers/my_avro_consumer
You should see the following in your terminal window:
{"instance_id":"my_consumer_instance","base_uri":"http://localhost:8082/consumers/my_avro_consumer/instances/my_consumer_instance"}Our next
curlcommand will retrieve data from a topic in our cluster (barin this case). The messages will be decoded, translated to JSON, and included in the response. The schema used for deserialization is retrieved automatically from the Schema Registry service, which we told the REST Proxy how to find by setting theKAFKA_REST_SCHEMA_REGISTRY_URLvariable on startup.curl -X GET -H "Accept: application/vnd.kafka.avro.v1+json" \ http://localhost:8082/consumers/my_avro_consumer/instances/my_consumer_instance/topics/barYou should see the following output:
[{"key":null,"value":{"f1":"value1"},"partition":0,"offset":0},{"key":null,"value":{"f1":"value2"},"partition":0,"offset":1},{"key":null,"value":{"f1":"value3"},"partition":0,"offset":2}]
Confluent Control Center
The Control Center application provides enterprise-grade capabilities for monitoring and managing your Confluent deployment. Control Center is part of the Confluent Enterprise offering; a trial license will support the image for the first 30 days after your deployment.
Stream Monitoring
First, let’s walk through how to use Confluent Control Center with console producers and consumers to monitor consumption and latency.
We’ll launch the Confluent Control Center image the same as we’ve done for earlier containers, connecting to the ZooKeeper and Kafka containers that are already running. This is also a good opportunity to illustrate mounted volumes, so we’ll first create a directory on the Docker Machine host for Control Center data.
docker-machine ssh confluent

docker@confluent:~$ mkdir -p /tmp/control-center/data
docker@confluent:~$ exit
Now we start Control Center, binding its data directory to the directory we just created and its HTTP interface to port 9021.
docker run -d \
  --name=control-center \
  --net=host \
  --ulimit nofile=16384:16384 \
  -p 9021:9021 \
  -v /tmp/control-center/data:/var/lib/confluent-control-center \
  -e CONTROL_CENTER_ZOOKEEPER_CONNECT=localhost:32181 \
  -e CONTROL_CENTER_BOOTSTRAP_SERVERS=localhost:29092 \
  -e CONTROL_CENTER_REPLICATION_FACTOR=1 \
  -e CONTROL_CENTER_MONITORING_INTERCEPTOR_TOPIC_PARTITIONS=1 \
  -e CONTROL_CENTER_INTERNAL_TOPICS_PARTITIONS=1 \
  -e CONTROL_CENTER_STREAMS_NUM_STREAM_THREADS=2 \
  -e CONTROL_CENTER_CONNECT_CLUSTER=http://localhost:28082 \
  confluentinc/cp-enterprise-control-center:3.1.2
Alert readers will notice that we have specified a URL for the Kafka Connect cluster that does not yet exist. Not to worry, we’ll work on that in the next section.
Control Center will create the topics it needs in Kafka. Check that it started correctly by searching it’s logs with the following command:
docker logs control-center | grep StartedYou should see the following
[2016-08-26 18:47:26,809] INFO Started NetworkTrafficServerConnector@26d96e5{HTTP/1.1}{0.0.0.0:9021} (org.eclipse.jetty.server.NetworkTrafficServerConnector)
[2016-08-26 18:47:26,811] INFO Started @5211ms (org.eclipse.jetty.server.Server)
To see the Control Center UI, open the link http://<ip-of-docker-host>:9021 in your browser. The Docker Host IP is displayed with the command
docker-machine ip confluent. If your docker daemon is running on a remote machine (such as an AWS EC2 instance), you’ll need to allow TCP access to that instance on port 9021. This is done in AWS by adding a “Custom TCP Rule” to the instance’s security group; the rule should all access to port 9021 from any source IP.Initially, the Stream Monitoring UI will have no data.
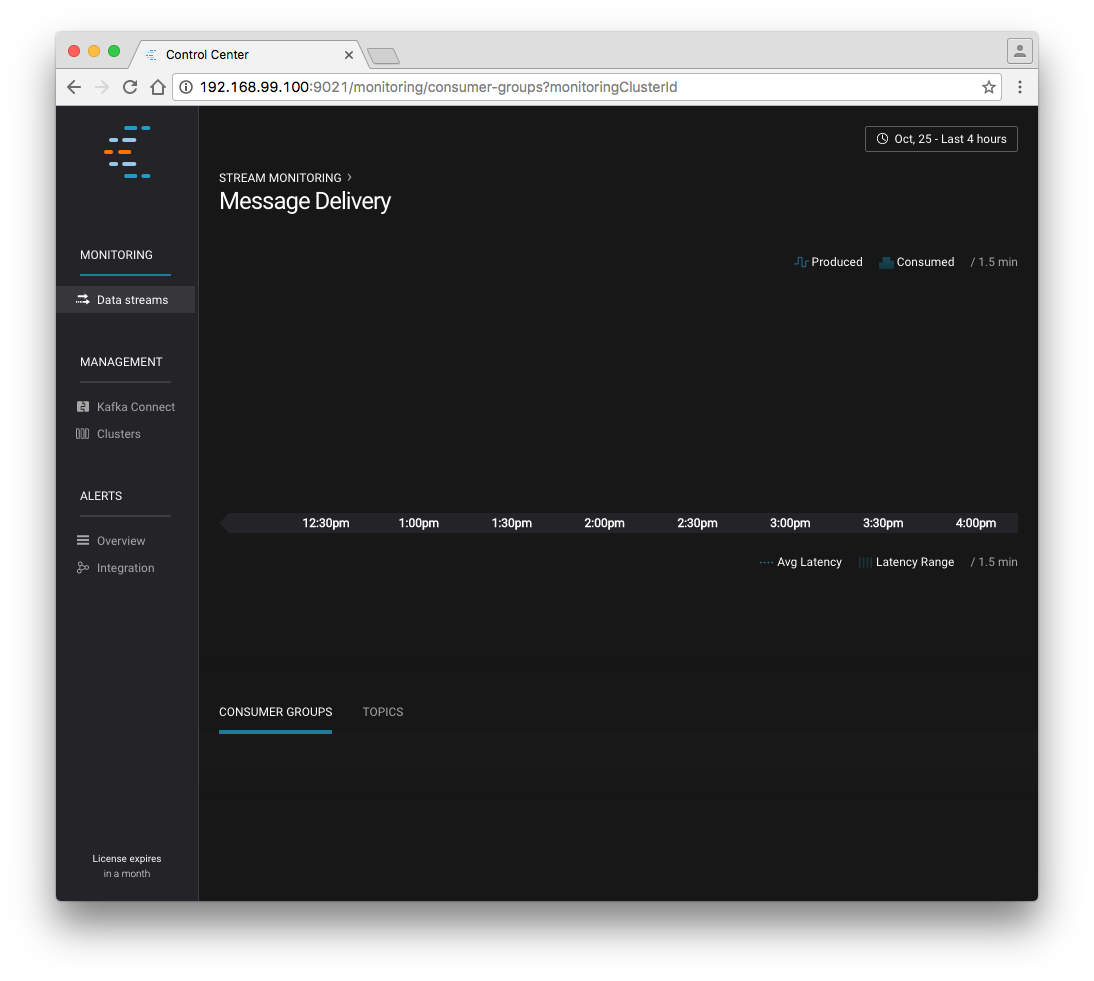
Confluent Control Center Initial View
Next, we’ll run the console producer and consumer with monitoring interceptors configured and see the data in Control Center. First we need to create a topic for testing.
docker run \
  --net=host \
  --rm confluentinc/cp-kafka:3.1.2 \
  kafka-topics --create --topic c3-test --partitions 1 --replication-factor 1 --if-not-exists --zookeeper localhost:32181
Now use the console producer with the monitoring interceptor enabled to send data
while true;
do
  docker run \
    --net=host \
    --rm \
    -e CLASSPATH=/usr/share/java/monitoring-interceptors/monitoring-interceptors-3.1.2.jar \
    confluentinc/cp-kafka-connect:3.1.2 \
    bash -c 'seq 10000 | kafka-console-producer --request-required-acks 1 --broker-list localhost:29092 --topic c3-test --producer-property interceptor.classes=io.confluent.monitoring.clients.interceptor.MonitoringProducerInterceptor --producer-property acks=1 && echo "Produced 10000 messages."'
    sleep 10;
done
This command will use the built-in Kafka Console Producer to produce 10000 simple messages on a 10 second interval to the
c3-testtopic. Upon running it, you should see the following:Produced 10000 messages.The message will repeat every 10 seconds, as successive iterations of the shell loop are executed. You can terminate the client with a
Ctrl+C.We’ll use the console consumer with the monitoring interceptor enabled to read the data. We’ll want to run this command in a separate terminal window (prepared with the
eval $(docker-machine env confluent)as we described earlier).OFFSET=0 while true; do docker run \ --net=host \ --rm \ -e CLASSPATH=/usr/share/java/monitoring-interceptors/monitoring-interceptors-3.1.2.jar \ confluentinc/cp-kafka-connect:3.1.2 \ bash -c 'kafka-console-consumer --consumer-property group.id=qs-consumer --consumer-property interceptor.classes=io.confluent.monitoring.clients.interceptor.MonitoringConsumerInterceptor --new-consumer --bootstrap-server localhost:29092 --topic c3-test --offset '$OFFSET' --partition 0 --max-messages=1000' sleep 1; let OFFSET=OFFSET+1000 doneIf everything is working as expected, each of the original messages we produced should be written back out:
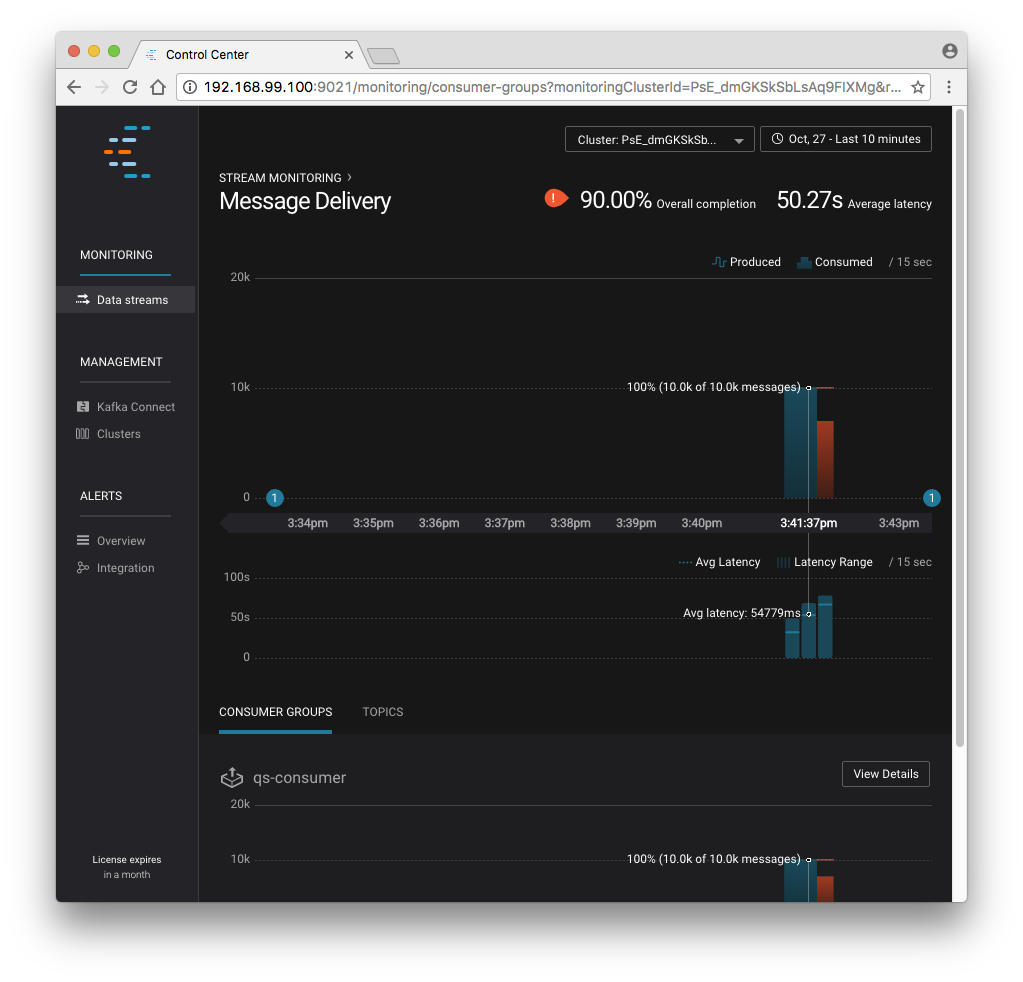
1
....
1000
Processed a total of 1000 messages
We’ve intentionally setup a slow consumer to consume at a rate of 1000 messages per second. You’ll soon reach a steady state where the producer window shows an update every 10 seconds while the consumer window shows bursts of 1000 messages received every 1 second. The monitoring activity should appear in the Control Center UI after 15 to 30 seconds. If you don’t see any activity, use the scaling selector in the upper left hand corner of the web page to select a smaller time window (the default is 4 hours, and you’ll want to zoom in to a 10-minute scale). You will notice there will be moments where the bars are colored red to reflect the slow consumption of data.
Alerts
Confluent Control Center provides alerting functionality to notify you when anomalous events occur in your cluster. This section assumes the console producer and consumer we launched to illustrate the stream monitoring features are still running in the background.
The Alerts / Overview link the lefthand navigation sidebar takes will display a history of all triggered events. To begin receiving alerts, we’ll need to create a trigger. Click the “Triggers” navigation item and then select “+ New trigger”.
Let’s configure a trigger to fire when the difference between our actual consumption and expected consumption is greater than 1000 messages:
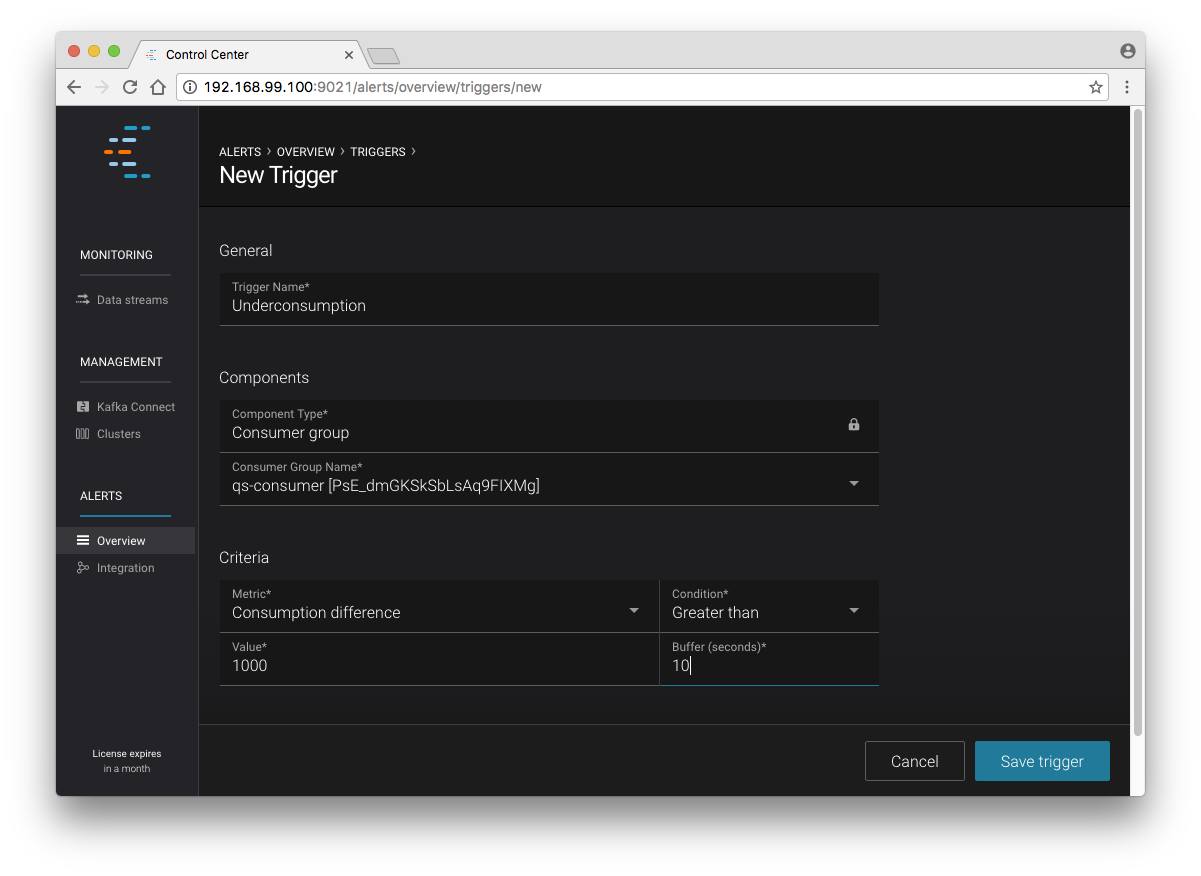
New trigger
Set the trigger name to be “Underconsumption”, which is what will be displayed
on the history page when our trigger fires. We need to select a specific
consumer group (qs-consumer) for this trigger. That’s the name of
the group we specified above in our invocation of
kafka-console-consumer.
Set the trigger metric to be “Consumption difference” where the condition is “Greater than” 1000 messages. The buffer time (in seconds) is the wall clock time we will wait before firing the trigger to make sure the trigger condition is not too transient.
After saving the trigger, Control Center will now prompt us to associate an action that will execute when our newly created trigger fires. For now, the only action is to send an email. Select our new trigger and choose maximum send rate for your alert email.
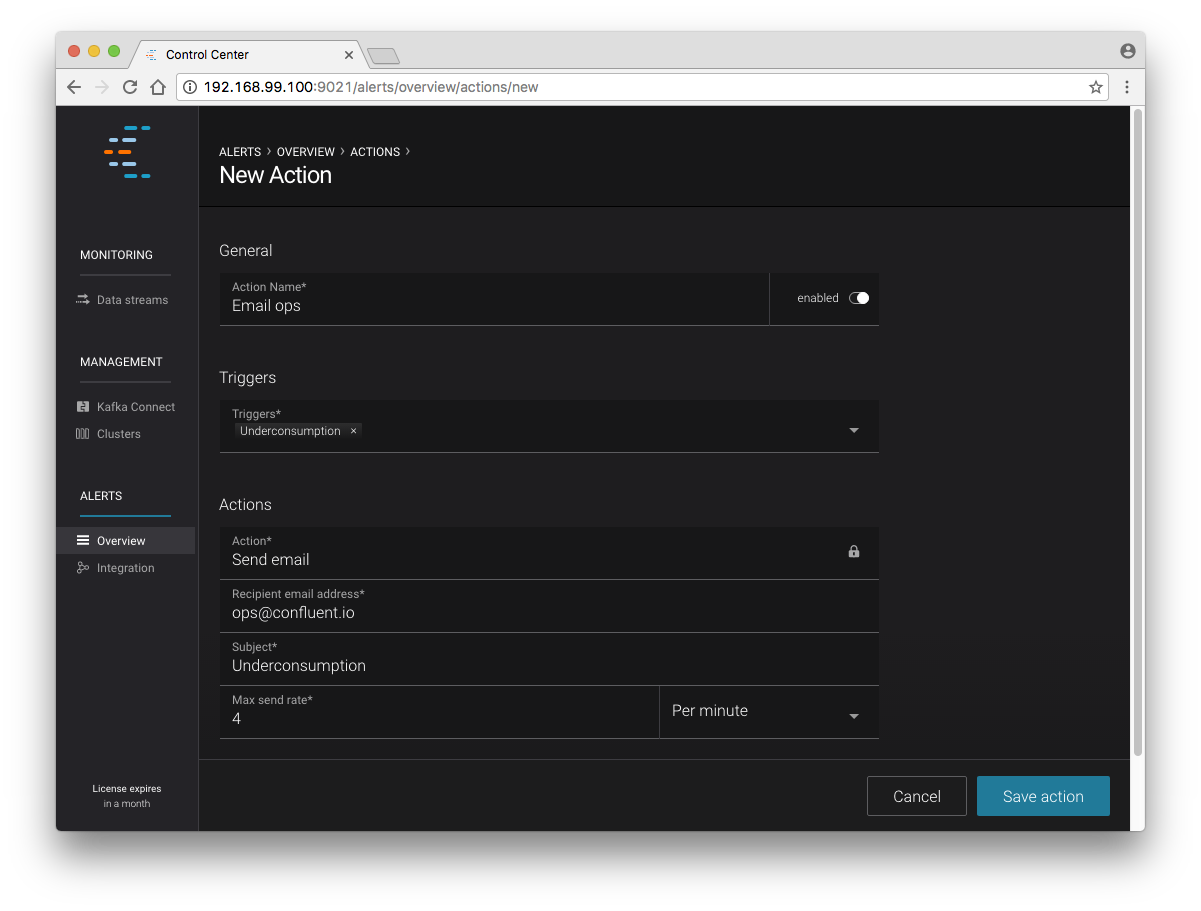
New action
Let’s return to our trigger history page. In a short while, you should see a new trigger show up in our alert history. This is because we setup our consumer to consume data at a slower rate than our producer.
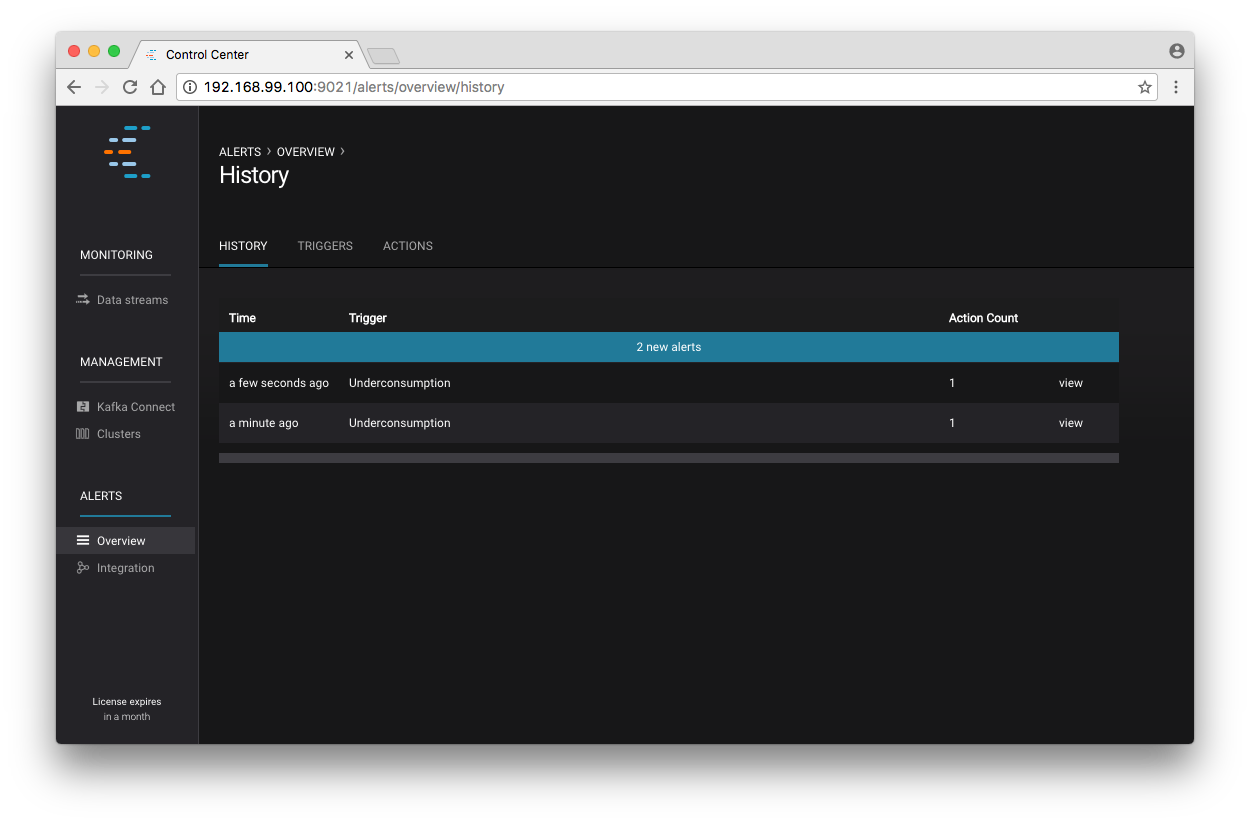
A newly triggered event
Kafka Connect
Getting Started
In this section, we’ll create a simple data pipeline using Kafka Connect. We’ll start by reading data from a file and writing that data to a new file. We will then extend the pipeline to show how to use Connect to read from a database table. This example is meant to be simple for the sake of this introductory tutorial. If you’d like a more in-depth example, please refer to our tutorial on Using a JDBC Connector with avro data.
First, let’s start up a container with Kafka Connect. Connect stores all its stateful data (configuration, status, and internal offsets for connectors) directly in Kafka topics. We will create these topics now in the Kafka cluster we have running from the steps above.
docker run \
  --net=host \
  --rm \
  confluentinc/cp-kafka:3.1.2 \
  kafka-topics --create --topic quickstart-offsets --partitions 1 --replication-factor 1 --if-not-exists --zookeeper localhost:32181
docker run \ --net=host \ --rm \ confluentinc/cp-kafka:3.1.2 \ kafka-topics --create --topic quickstart-config --partitions 1 --replication-factor 1 --if-not-exists --zookeeper localhost:32181docker run \ --net=host \ --rm \ confluentinc/cp-kafka:3.1.2 \ kafka-topics --create --topic quickstart-status --partitions 1 --replication-factor 1 --if-not-exists --zookeeper localhost:32181Note
It is possible to allow connect to auto-create these topics by enabling the autocreation setting. However, we recommend doing it manually, as these topics are important for connect to function and you’ll likely want to control settings such as replication factor and number of partitions.
Next, we’ll create a topic for storing data that we’re going to be sending to Kafka for this tutorial.
docker run \
  --net=host \
  --rm \
  confluentinc/cp-kafka:3.1.2 \
  kafka-topics --create --topic quickstart-data --partitions 1 --replication-factor 1 --if-not-exists --zookeeper localhost:32181
Now you should verify that the topics are created before moving on:
docker run \
   --net=host \
   --rm \
   confluentinc/cp-kafka:3.1.2 \
   kafka-topics --describe --zookeeper localhost:32181
For this example, we’ll create a FileSourceConnector, a FileSinkConnector and directories for storing the input and output files. If you are running Docker Machine then you will need to SSH into the VM to run these commands by running docker-machine ssh <your machine name>.
First, let’s create the directory where we’ll store the input and output data files. Remember, we must do this within the Docker Host.
docker-machine ssh confluent

docker@confluent:~$ mkdir -p /tmp/quickstart/file
docker@confluent:~$ exit
Next, start a Connect worker in distributed mode:
docker run -d \
  --name=kafka-connect \
  --net=host \
  -e CONNECT_PRODUCER_INTERCEPTOR_CLASSES=io.confluent.monitoring.clients.interceptor.MonitoringProducerInterceptor \
  -e CONNECT_CONSUMER_INTERCEPTOR_CLASSES=io.confluent.monitoring.clients.interceptor.MonitoringConsumerInterceptor \
  -e CONNECT_BOOTSTRAP_SERVERS=localhost:29092 \
  -e CONNECT_REST_PORT=28082 \
  -e CONNECT_GROUP_ID="quickstart" \
  -e CONNECT_CONFIG_STORAGE_TOPIC="quickstart-config" \
  -e CONNECT_OFFSET_STORAGE_TOPIC="quickstart-offsets" \
  -e CONNECT_STATUS_STORAGE_TOPIC="quickstart-status" \
  -e CONNECT_KEY_CONVERTER="org.apache.kafka.connect.json.JsonConverter" \
  -e CONNECT_VALUE_CONVERTER="org.apache.kafka.connect.json.JsonConverter" \
  -e CONNECT_INTERNAL_KEY_CONVERTER="org.apache.kafka.connect.json.JsonConverter" \
  -e CONNECT_INTERNAL_VALUE_CONVERTER="org.apache.kafka.connect.json.JsonConverter" \
  -e CONNECT_REST_ADVERTISED_HOST_NAME="localhost" \
  -e CONNECT_LOG4J_ROOT_LOGLEVEL=DEBUG \
  -v /tmp/quickstart/file:/tmp/quickstart \
  confluentinc/cp-kafka-connect:3.1.2
As you can see in the above command, we tell Connect to refer to the three topics we create in the first step of this Connect tutorial. Let’s check to make sure that the Connect worker is up by running the following command to search the logs:
docker logs kafka-connect | grep startedYou should see the following
[2016-08-25 18:25:19,665] INFO Herder started (org.apache.kafka.connect.runtime.distributed.DistributedHerder)
[2016-08-25 18:25:19,676] INFO Kafka Connect started (org.apache.kafka.connect.runtime.Connect)
We will now create our first connector for reading a file from disk. To do this, let’s start by creating a file with some data. Again, if you are running Docker Machine then you will need to SSH into the VM to run these commands by running
docker-machine ssh <your machine name>. (You may also need to run the command as root).docker-machine ssh confluent docker@confluent:~$ seq 1000 > /tmp/quickstart/file/input.txt
Now create the connector using the Kafka Connect REST API. (Note: Make sure you have curl installed!)
Set the
CONNECT_HOSTenvironment variable. If you are running this on Docker Machine, then the hostname will need to bedocker-machine ip <your docker machine name>. If you are running on a cloud provider like AWS, you will either need to have port28082open or you can SSH into the VM and run the following command:docker@confluent:~$ export CONNECT_HOST=localhostThe next step is to create the File Source connector.
docker@confluent:~$: curl -X POST \
  -H "Content-Type: application/json" \
  --data '{"name": "quickstart-file-source", "config": {"connector.class":"org.apache.kafka.connect.file.FileStreamSourceConnector", "tasks.max":"1", "topic":"quickstart-data", "file": "/tmp/quickstart/input.txt"}}' \
  http://$CONNECT_HOST:28082/connectors
Upon running the command, you should see the following output in your terminal window:
{"name":"quickstart-file-source","config":{"connector.class":"org.apache.kafka.connect.file.FileStreamSourceConnector","tasks.max":"1","topic":"quickstart-data","file":"/tmp/quickstart/input.txt","name":"quickstart-file-source"},"tasks":[]}Before moving on, let’s check the status of the connector using curl as shown below:
docker@confluent:~$: curl -X GET http://$CONNECT_HOST:28082/connectors/quickstart-file-source/statusYou should see the following output including the
stateof the connector asRUNNING:{"name":"quickstart-file-source","connector":{"state":"RUNNING","worker_id":"localhost:28082"},"tasks":[{"state":"RUNNING","id":0,"worker_id":"localhost:28082"}]}
Now that the connector is up and running, let’s try reading a sample of 10 records from the quickstart-data topic to check if the connector is uploading data to Kafka, as expected. You’ll want to do this in a separate terminal window, retaining the ssh session to the Docker Host for later commands.
docker run \
 --net=host \
 --rm \
 confluentinc/cp-kafka:3.1.2 \
 kafka-console-consumer --bootstrap-server localhost:29092 --topic quickstart-data --new-consumer --from-beginning --max-messages 10
You should see the following:
{"schema":{"type":"string","optional":false},"payload":"1"}
{"schema":{"type":"string","optional":false},"payload":"2"}
{"schema":{"type":"string","optional":false},"payload":"3"}
{"schema":{"type":"string","optional":false},"payload":"4"}
{"schema":{"type":"string","optional":false},"payload":"5"}
{"schema":{"type":"string","optional":false},"payload":"6"}
{"schema":{"type":"string","optional":false},"payload":"7"}
{"schema":{"type":"string","optional":false},"payload":"8"}
{"schema":{"type":"string","optional":false},"payload":"9"}
{"schema":{"type":"string","optional":false},"payload":"10"}
Processed a total of 10 messages
Success! We now have a functioning source connector! Now let’s bring balance to the universe by launching a File Sink to read from this topic and write to an output file. You can do so using the following command from the Docker Host session started earlier:
docker@confluent:~$ curl -X POST -H "Content-Type: application/json" \
    --data '{"name": "quickstart-file-sink", "config": {"connector.class":"org.apache.kafka.connect.file.FileStreamSinkConnector", "tasks.max":"1", "topics":"quickstart-data", "file": "/tmp/quickstart/output.txt"}}' \
    http://$CONNECT_HOST:28082/connectors
You should see the output below in your terminal window, confirming that the
quickstart-file-sinkconnector has been created and will write to/tmp/quickstart/output.txt:{"name":"quickstart-file-sink","config":{"connector.class":"org.apache.kafka.connect.file.FileStreamSinkConnector","tasks.max":"1","topics":"quickstart-data","file":"/tmp/quickstart/output.txt","name":"quickstart-file-sink"},"tasks":[]}As we did before, let’s check the status of the connector:
docker@confluent:~$ curl -s -X GET http://$CONNECT_HOST:28082/connectors/quickstart-file-sink/statusYou should see the following message in your terminal window:
{"name":"quickstart-file-sink","connector":{"state":"RUNNING","worker_id":"localhost:28082"},"tasks":[{"state":"RUNNING","id":0,"worker_id":"localhost:28082"}]}Finally, let’s check the file to see if the data is present. Once again, you will need to SSH into the VM if you are running Docker Machine.
docker@confluent:~$ cat /tmp/quickstart/file/output.txtIf everything worked as planned, you should see all of the data we originally wrote to the input file:
1
...
1000
As we’re done with the Docker Host session for now, you can exit it with the following command
docker@confluent:~$ exit
Monitoring in Control Center
Next we’ll see how to monitor the Kafka Connect connectors in Control Center. Because we specified the monitoring interceptors when we deployed the Connect container, the data flows through all of our connectors will monitored in the same ways as the console producer/consumer tasks we executed above. Additionally, Control Center allows us to visually manage and deploy connectors, as you’ll see now.
Select the Management / Kafka Connect link in the Control Center navigation bar. Select the
SOURCESandSINKStabs at the top of the page to see that both the source and sink are running.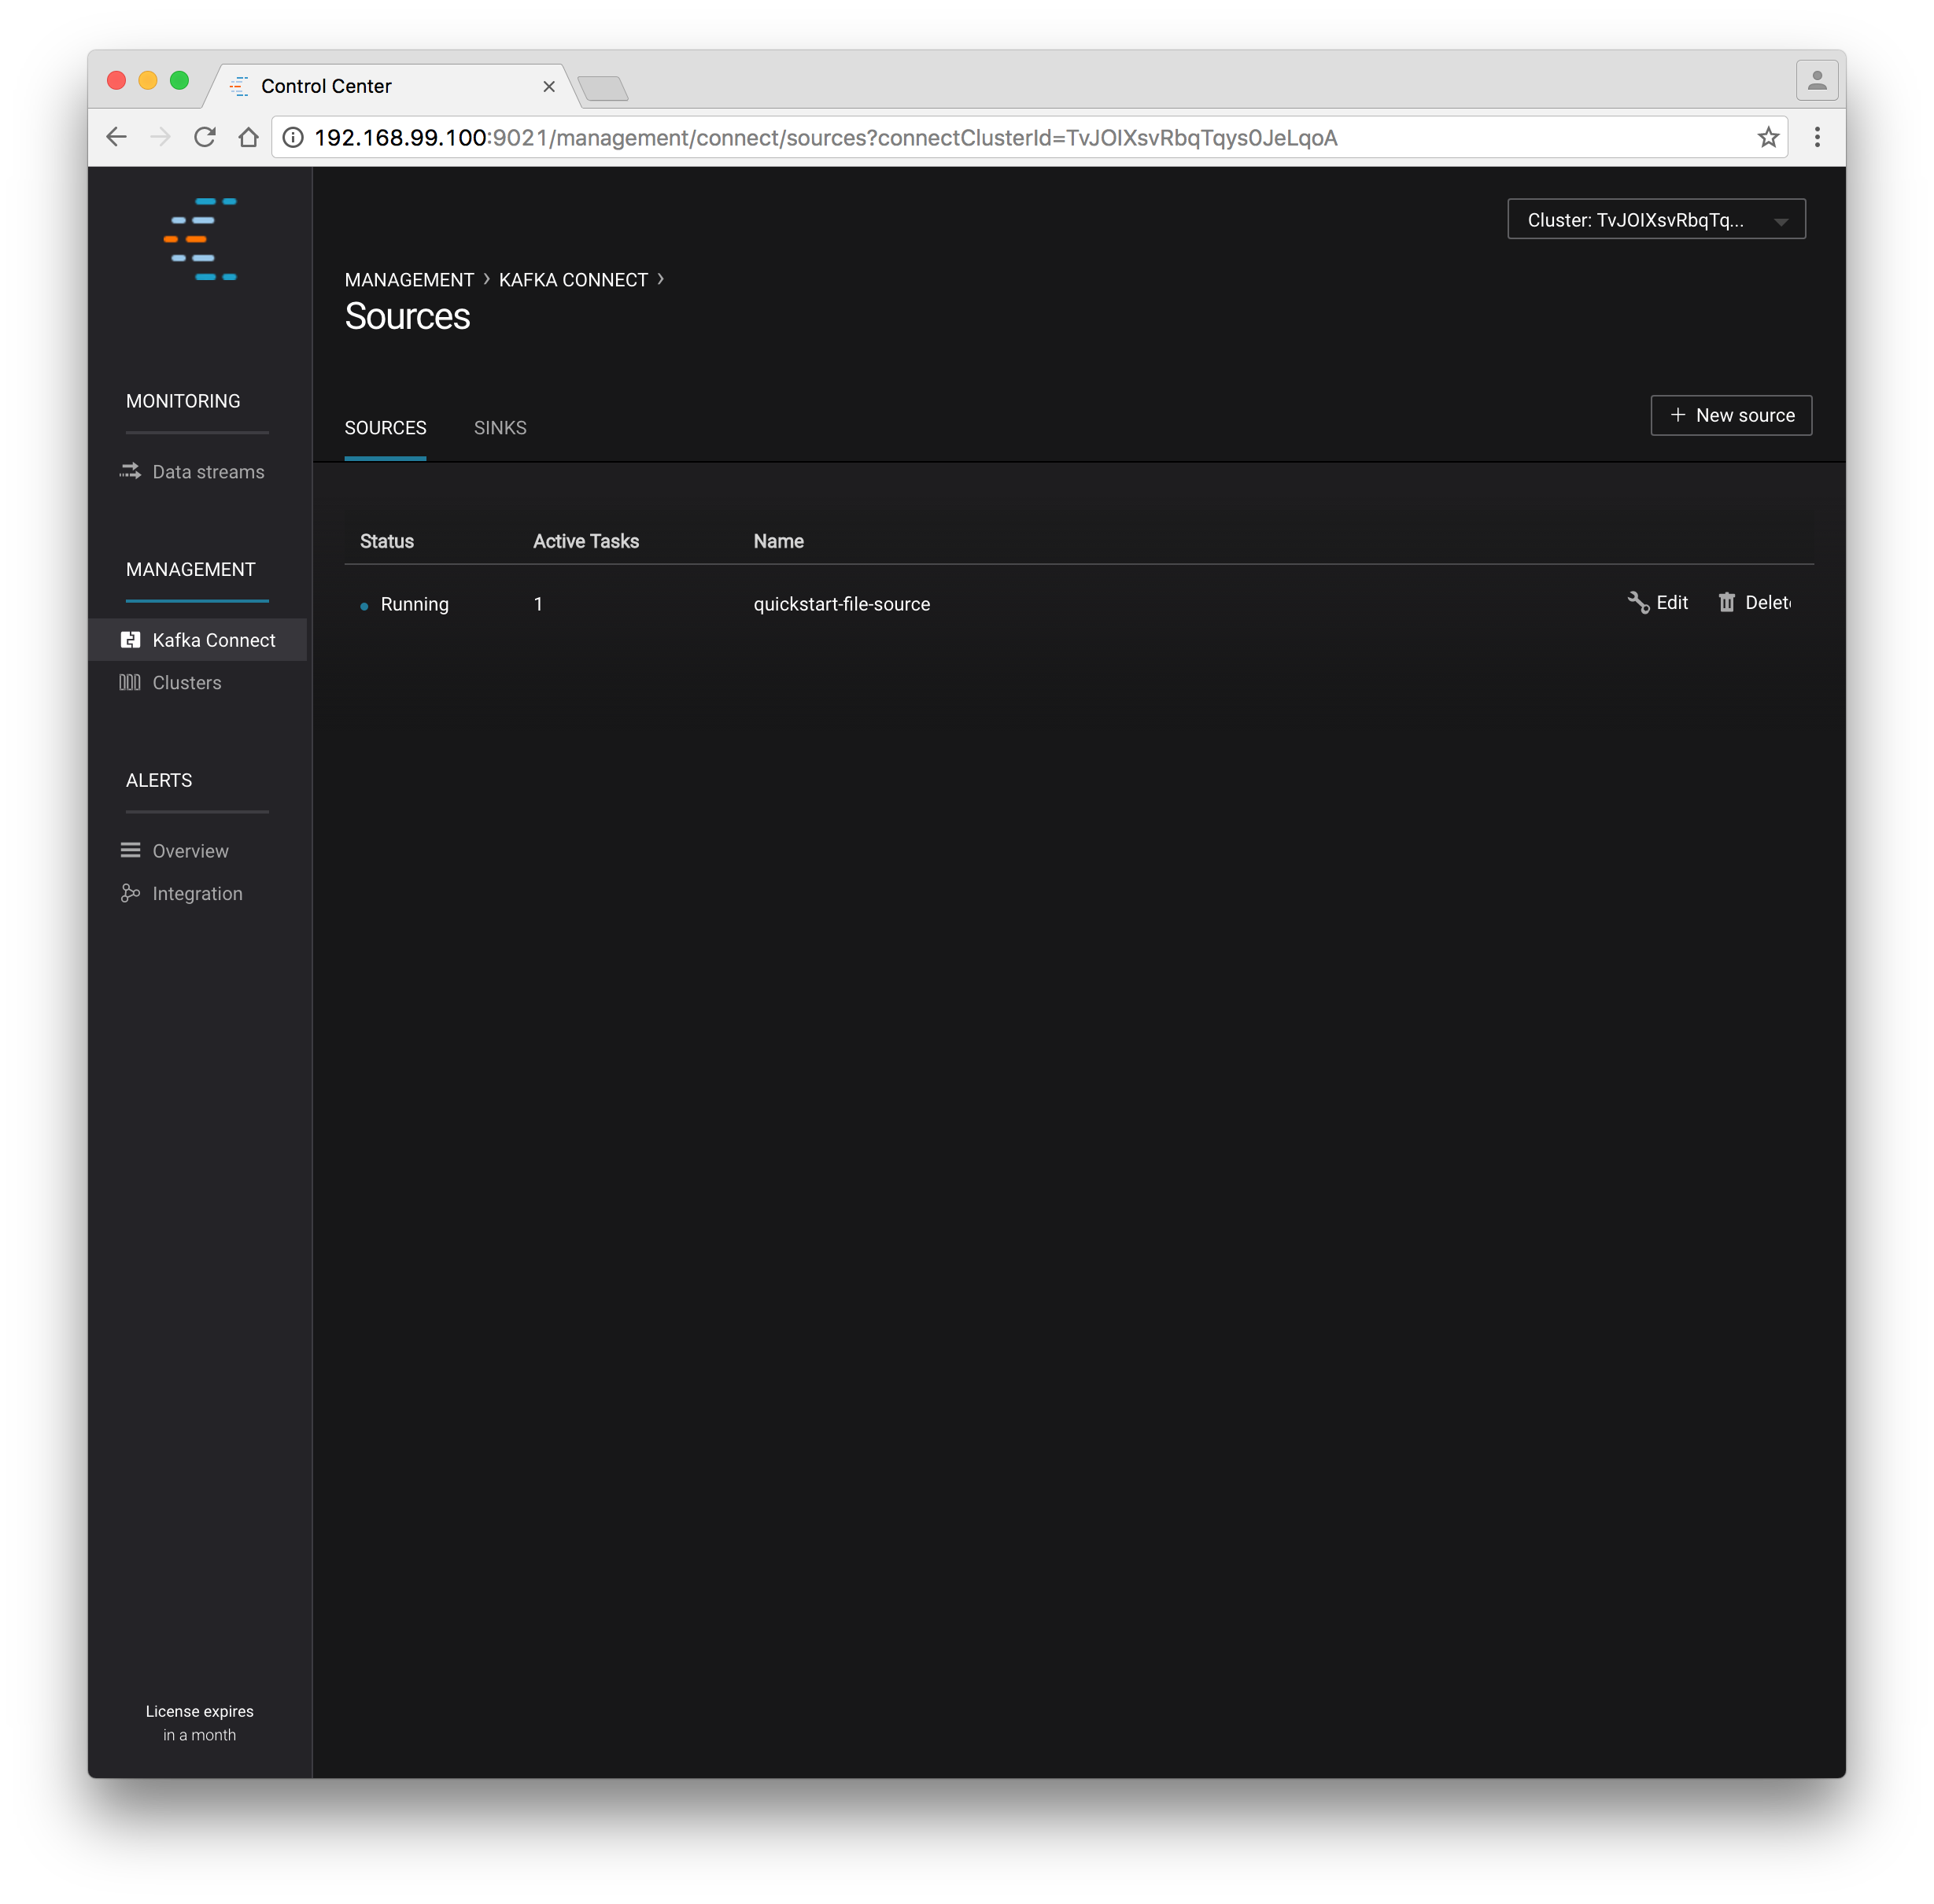
Confluent Control Center showing a Connect source
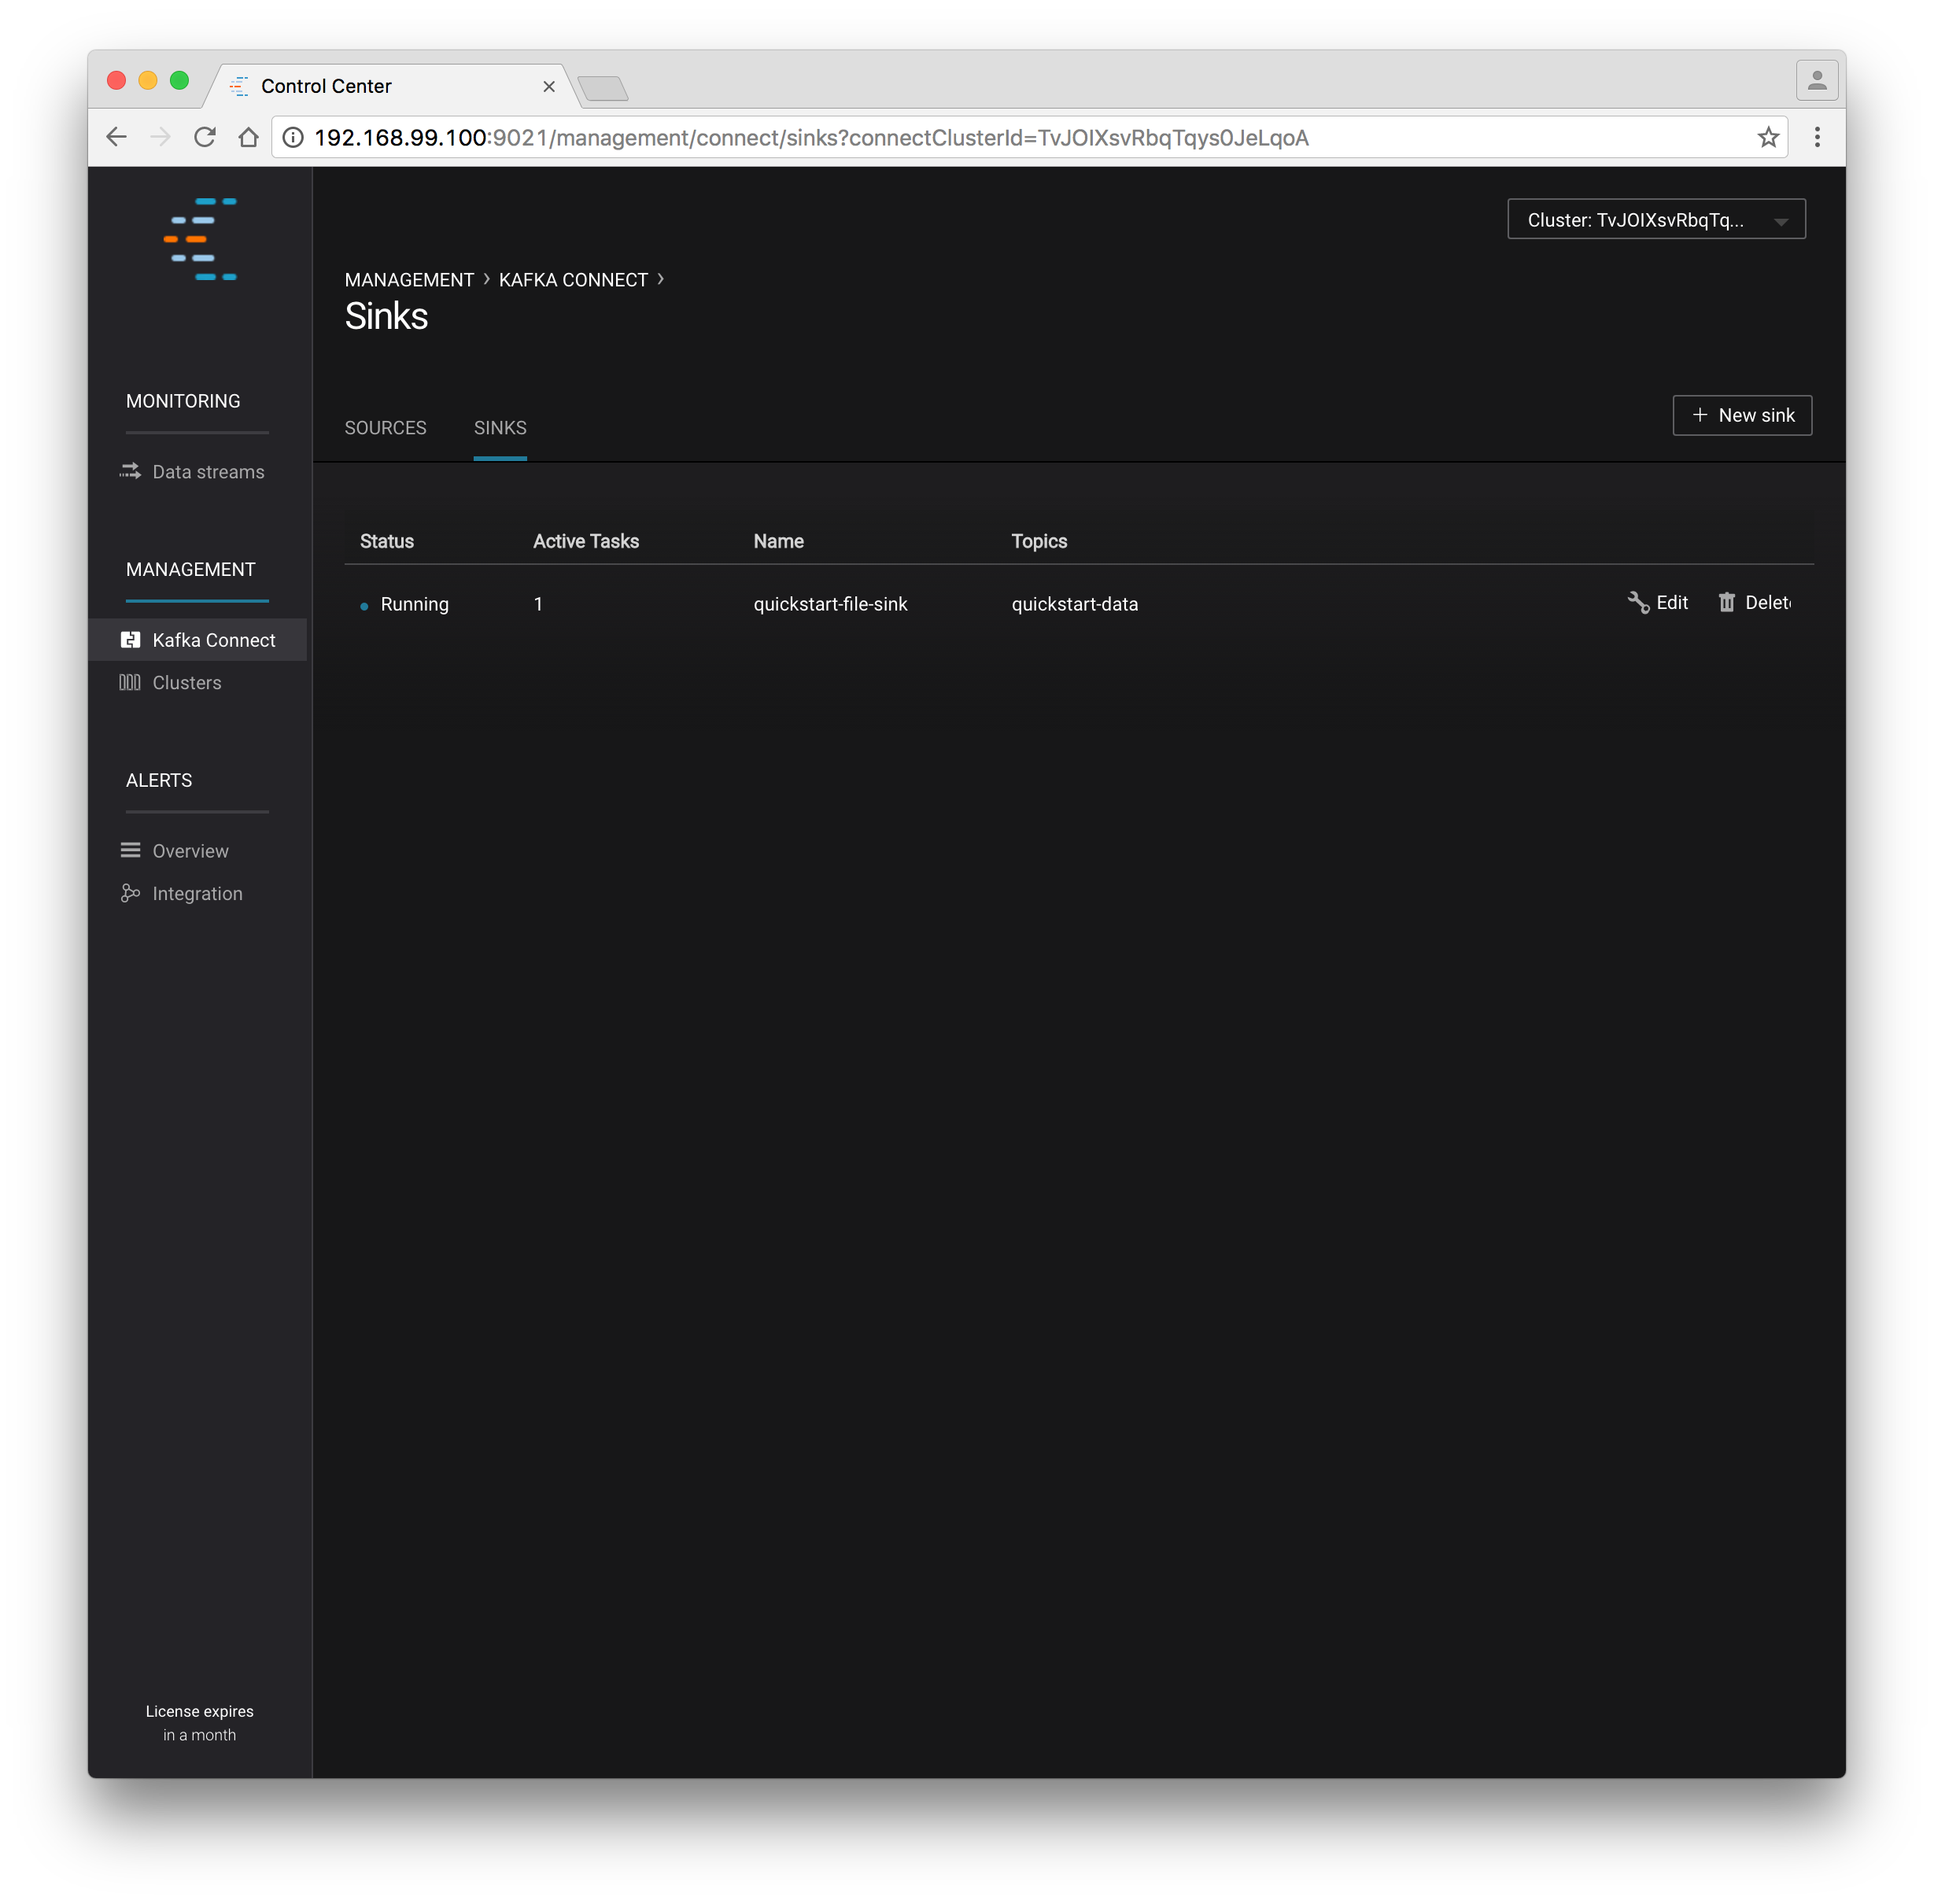
Confluent Control Center showing a Connect sink
You should start to see stream monitoring data from Kafka Connect in the Control Center UI from the running connectors. Remember that the file contained only 1000 messages, so you’ll only see a short spike of topic data.
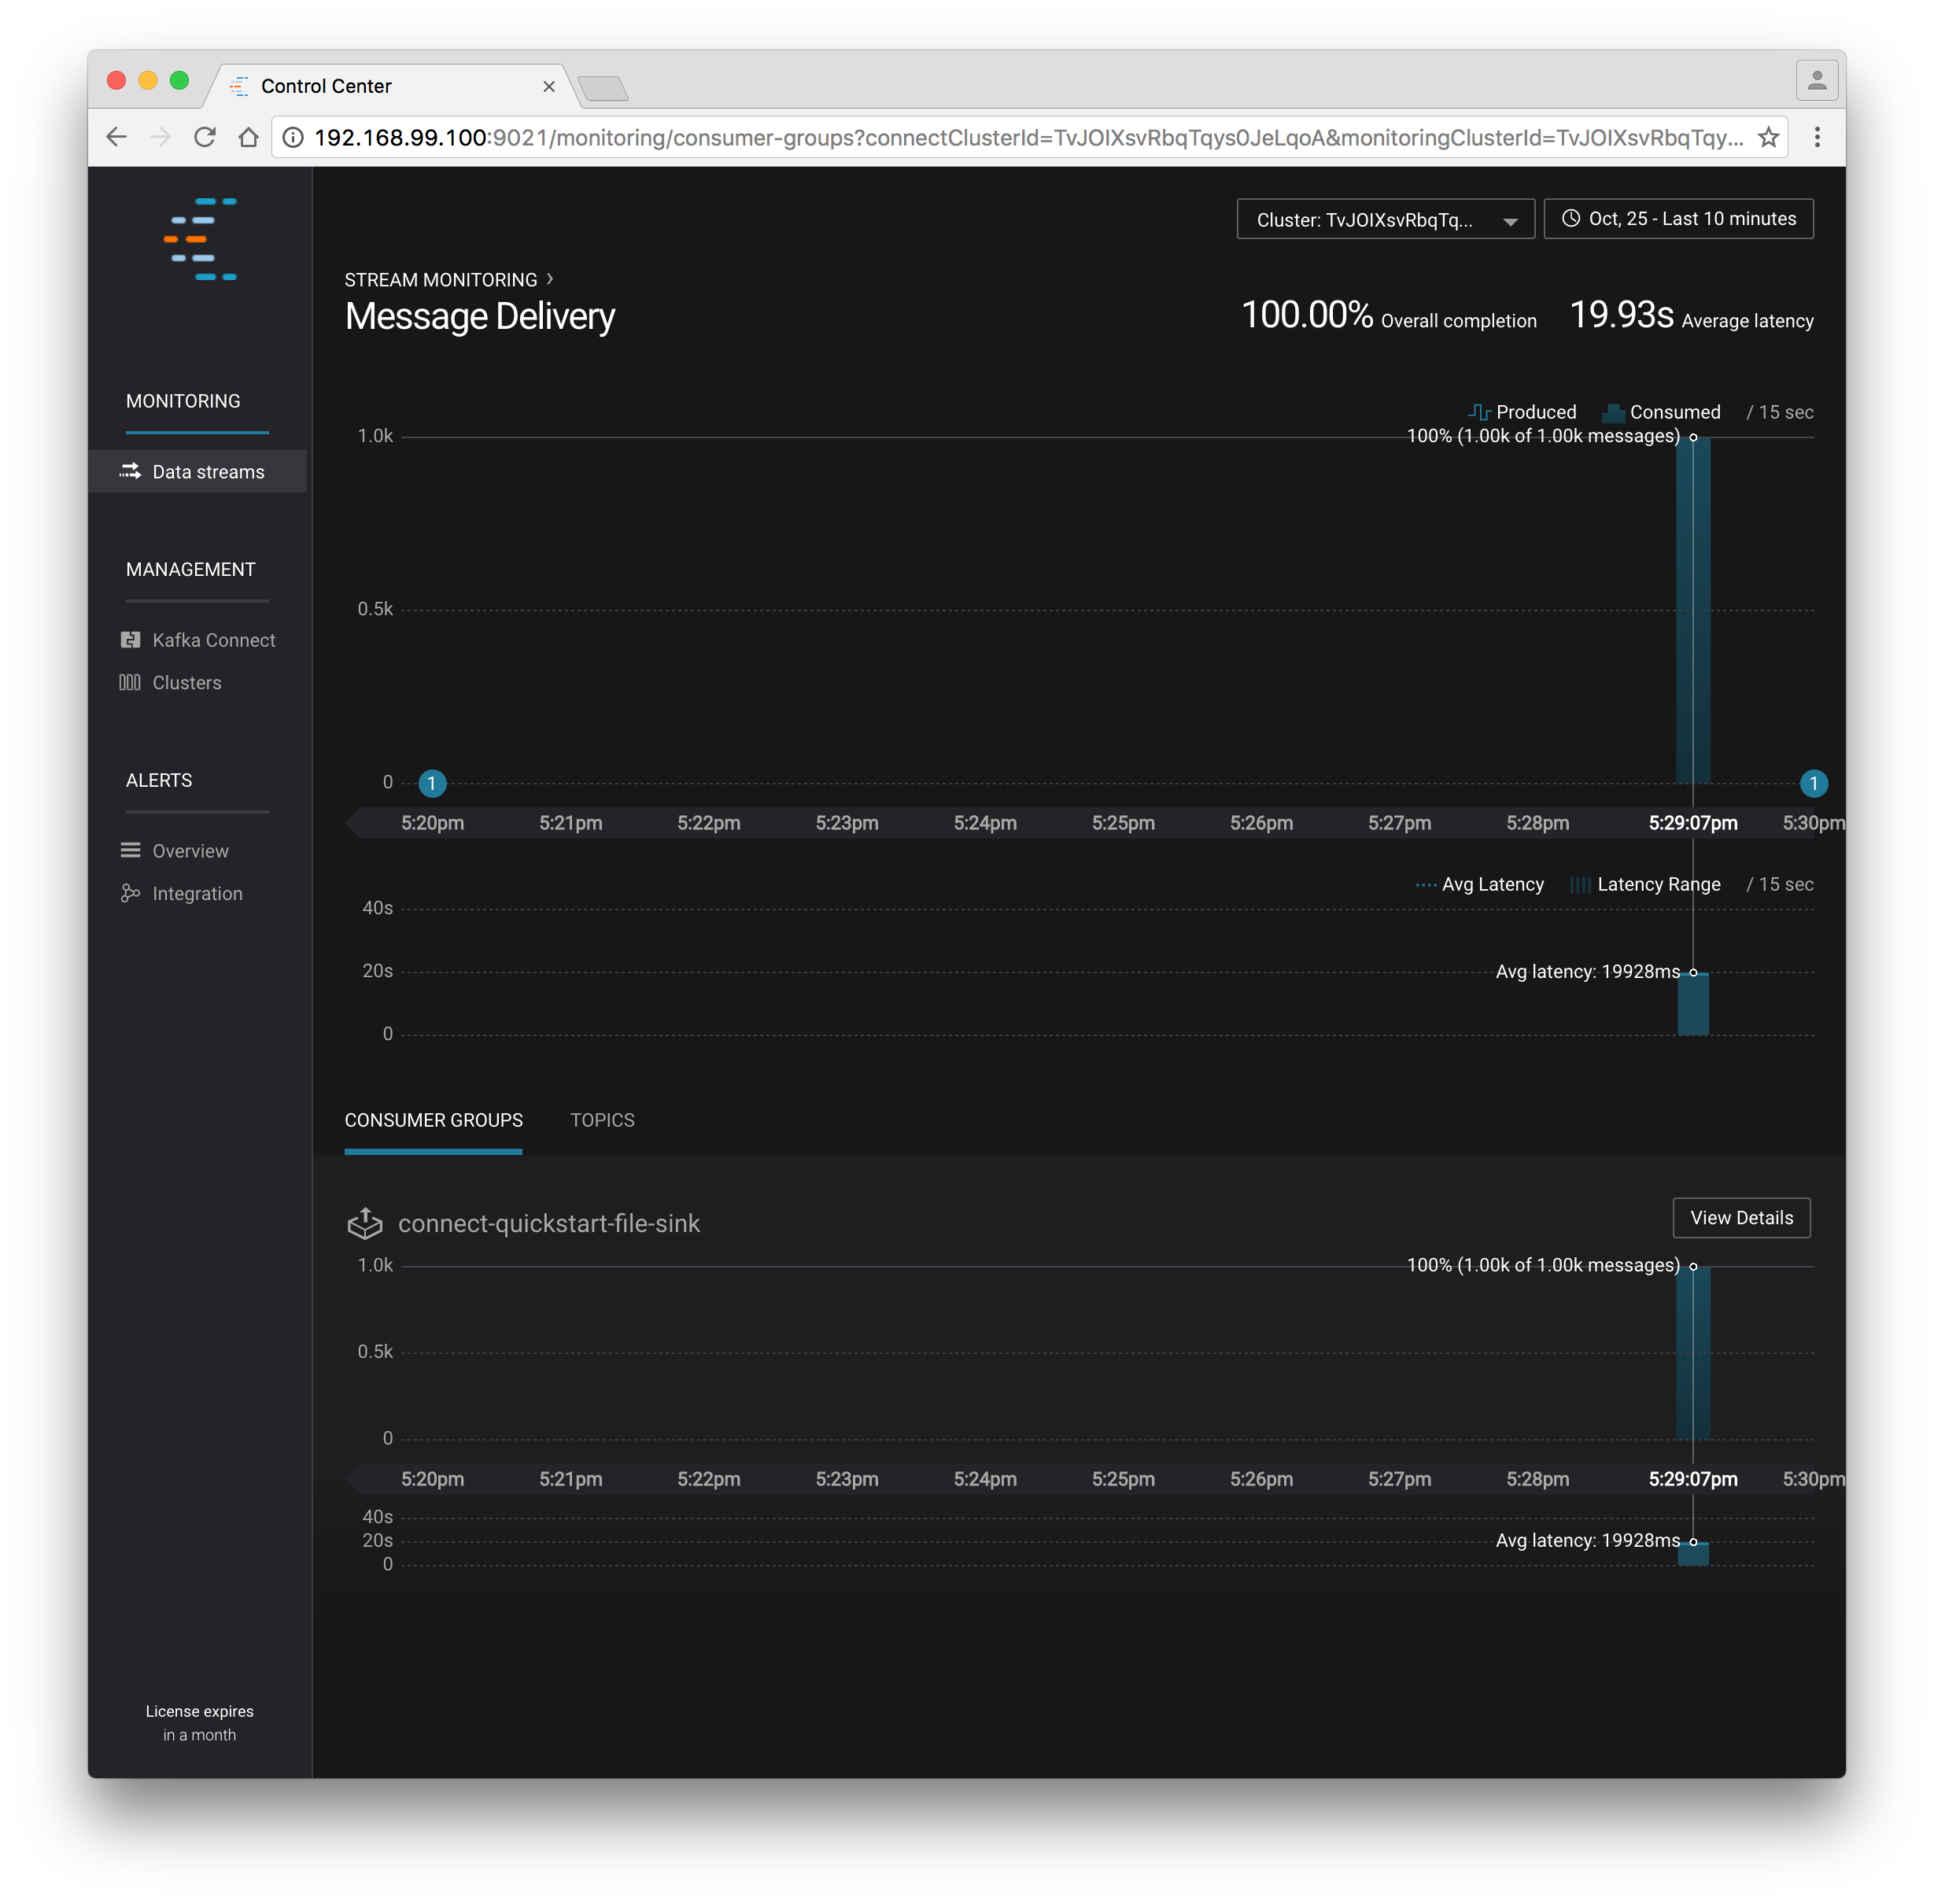
Confluent Control Center monitoring Kafka Connect
Cleanup
Once you’re done, cleaning up is simple. Run the command docker rm -f $(docker ps -a -q) to delete all the containers we created in the steps above for your target Docker Host. Because we allowed Kafka and Zookeeper to store data on their respective containers, there are no additional volumes to clean up. If you also want to remove the Docker machine you used, you can do so using docker-machine rm <your machine name>.
Getting Started with Docker Compose
Docker Compose is a powerful tool that enables you to launch multiple docker images in a coordinated fashion. It is ideal for platforms like Confluent. Before you get started, you will need to install both the core Docker Engine and Docker Compose. Once you’ve done that, you can follow the steps below to start up the Confluent Platform services.
- Create and configure the Docker Machine {if you don’t want to reuse your Docker Host from the Quickstart above} (OS X only).
docker-machine create --driver virtualbox --virtualbox-memory 6000 confluentNext, configure your terminal window to attach it to your new Docker Machine:
eval $(docker-machine env confluent)
- Clone the CP Docker Images Github Repository.
git clone https://github.com/confluentinc/cp-docker-imagesWe have provided an example Docker Compose file that will start up Zookeeper and Kafka. Navigate to
cp-docker-images/examples/kafka-single-node, where it is located. Alternatively, you can download the file directly from https://github.com/confluentinc/cp-docker-images/raw/master/examples/kafka-single-node/docker-compose.yml
Start Zookeeper and Kafka using Docker Compose
createandstartcommands. You’ll run these commands from the directory containing the docker-compose.yml file.docker-compose create docker-compose start
Before we move on, let’s make sure the services are up and running:
docker-compose ps
You should see the following:
           Name                        Command            State   Ports
-----------------------------------------------------------------------
kafkasinglenode_kafka_1       /etc/confluent/docker/run   Up
kafkasinglenode_zookeeper_1   /etc/confluent/docker/run   Up
Now check the Zookeeper logs to verify that Zookeeper is healthy.
docker-compose logs zookeeper | grep -i bindingYou should see the following in your terminal window:
zookeeper_1 | [2016-07-25 03:26:04,018] INFO binding to port 0.0.0.0/0.0.0.0:32181 (org.apache.zookeeper.server.NIOServerCnxnFactory)
Next, check the Kafka logs to verify that broker is healthy.
docker-compose logs kafka | grep -i startedYou should see message a message that looks like the following:
kafka_1 | [2016-07-25 03:26:06,007] INFO [Kafka Server 1], started (kafka.server.KafkaServer)
Follow step 4 in “Running Confluent Platform in Docker” guide above to test the broker.
The confluentinc/cp-docker-images github repository has several other interesting examples of docker-compose.yml files that you can use.