Outline Pane
The Outline pane contains a list of all elements of the currently used graph.
Ports - list of connected input and output ports. Available in subgraphs only. See Optional Ports
Components - list of components used in the selected graph. See Chapter 30, Components
Metadata - list of metadata assignable to edges in selected graph. See Chapter 32, Metadata
Connections - list of connections used in the graph. See Chapter 33, Connections
Parameters - See Chapter 36, Parameters
Sequences - See Chapter 35, Sequences
Lookups - See Chapter 34, Lookup Tables
Notes - See Chapter 39, Notes in the Graphs
Dictionaries - See Chapter 38, Dictionary
The graph components, edges metadata, database connections or JMS connections, lookups, parameters, sequences, and notes are editable from the Outline. You can both create internal properties and link external (shared) ones. Internal properties are contained in the graph and are visible there. You can externalize the internal properties and/or internalize the external (shared) properties. You can also export the internal metadata. If you select any item in the Outline pane (component, connection, metadata, etc.) and press Enter, its editor will open.
![[Tip]](figures/tip.png) | Tip |
|---|---|
Activate the Link with Editor yellow icon in the top right corner and every time you select a component in the graph editor Clover will select it in the Outline as well. Although this is convenient for smaller graphs, turn this off for complex graphs to prevent the outline from expanding the big list of components again and again when as you are working in the graph. |
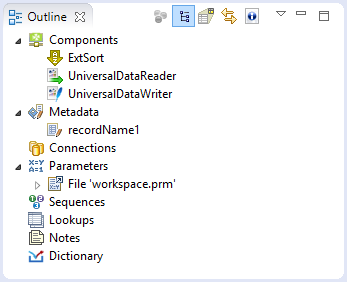
Figure 20.14. Outline Pane
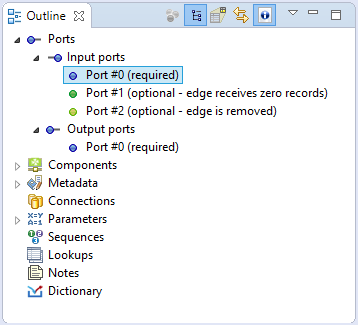
Figure 20.15. Outline Pane - Subgraphs
Outline Pane Buttons
The Outline Pane Buttons affect what is being displayed in the Outline. There are two buttons in the upper right part of the Outline switching between Tree View and Graph Minimap and a Link With Editor button.
Tree View
In the tree view you can see the tree of components, metadata, connections, parameters, sequences, lookups and notes. Tree View is the default Outline view.
Graph Minimap
The Graph Minimap is an Outline view not displaying the graph elements but the preview.
To switch to the Graph Minimap use the second button from the left in the top of the Outline.
 |
Figure 20.16. Outline Pane with Minimap
You can see a part of some of the example graphs in the Graph Editor and you can see the same graph structure in the Outline pane. In addition to it, there is a light-blue rectangle in the Outline pane. You can see exactly the same part of the graph as you can see in the Graph Editor within the light-blue rectangle in the Outline pane. By moving this rectangle within the space of the Outline pane, you can see the corresponding part of the graph in the Graph Editor as it moves along with the rectangle. Both the light blue-rectangle and the graph in the Graph Editor move equally.
You can do the same with the help of the scroll bars on the right and bottom sides of the Graph Editor.
To switch to the tree representation of the Outline pane, you only need to click the button that is the first from the left in the upper right part of the Outline pane.
Link With Editor
Link With Editor button switches on a link between the currently selected element from the Outline and the currently selected element from the Graph Editor. If you click on a component in a Graph Editor and this option is enabled, the component will be highlighted in the Outline too.
Show Element IDs
Show Element IDs shows or hides element IDs of graph elements (components, metadata, ...) in Outline. Element ID is displayed behind the corresponding element name.
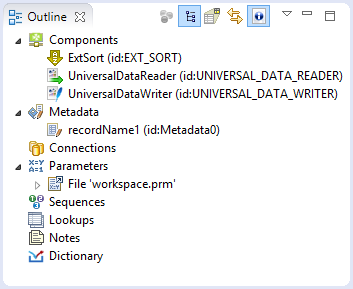
Figure 20.17. Show Element ID Enabled
Cleanup Unused Elements
ETL Graph Cleanup assists you to remove unused elements from a graph. The dialog helps you to remove unused metadata, connections, sequences or lookup tables or dictionaries, but it does not remove unused parameters. The removal of unused parameters might affect other graphs in the project.
The ETL Graph Cleanup can be opened by right click from Outline pane or Graph Editor pane using Cleanup unused elements option.
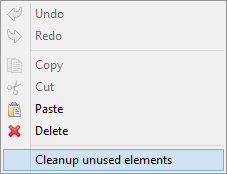
Figure 20.18. Opening the ETL Graph Cleanup
If you open the dialog, the unused parameters will be preselected. You can unselect any of preselected items or add any item or items.
The ETL Graph Cleanup dialog contains buttons to Select all elements, to Deselect all elements and to Reset to default selection of elements.
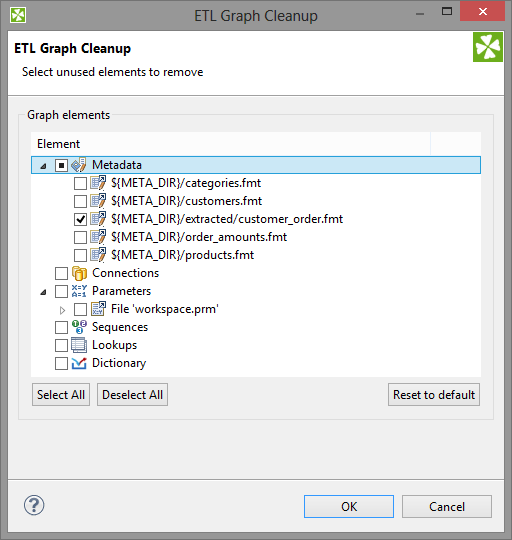
Figure 20.19. ETL Graph Cleanup
Locking Elements
In Outline, you can lock any of the shared graph elements. A lock is just a flag (with an optional text message) that you deliberately assign to an element so that others attempting to modify the element know it might not be a good idea. These graph elements can be locked:
Metadata
Connections
Sequences
Lookups
How to Lock
To lock any of these elements, right click it in Outline and click Lock.
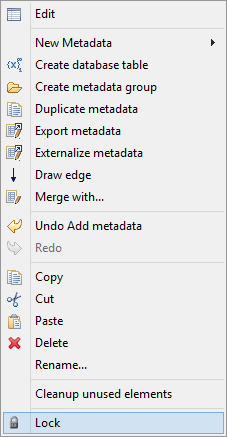
Figure 20.20. Locking an Element
Provide a message to be displayed if a locked item is being edited. You can use the default one.
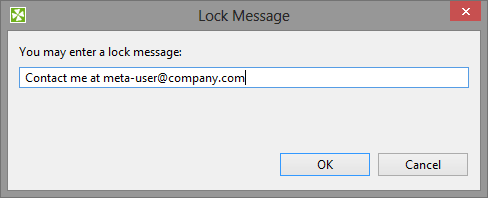
Figure 20.21. Locking an Element - Message dialog
![[Note]](figures/note.png) | Note |
|---|---|
Locks are by no means a security tool - anyone can perform unlock and locks are not owned by users. |
Locked Elements
In various places (such as the Transform Editor), you are warned if you are accessing a locked element, e.g. modifying locked metadata.
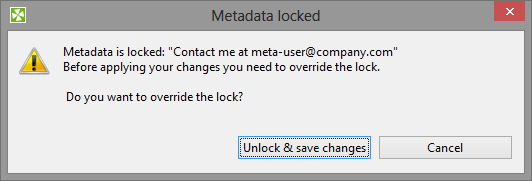
Figure 20.22. Accessing a locked graph element - you can add any text you like to describe the lock.