Chapter 27. Graph Tracking
The CloverETL engine provides various tracking information about running graphs. The most important information is used to populate the Tracking view, located on bottom of the CloverETL perspective (see the designer's tabs).
The same source of data is used for displaying decorations on graph elements. The number of transferred records appears the along edges of a running graph. The phase edges have two numbers, the left end of the edge shows the number of data records sent to the edge, and the right end of the edge shows the number of data records already read from the phase edge.
Figure 27.1. Edge tracking example
In case the graph is running in the CloverETL Cluster environment with a multi-worker allocation, the in-graph tracking information can go into even more detail. Each component displays the number of instances of the component - i.e. parallel executions. Tracking information on edges is available in three levels of detail - low, medium and high. The level can be changed in Window/Preference/CloverETL/Tracking page. Or press 'D' to iterate over all levels of tracking details directly in the graph editor.
The low level of tracking detail shows the total number of transferred records over all workers/partitions.
The medium level shows the total number of transferred records as well as additional drill down information - the number of passed records and skew for each processing partition.
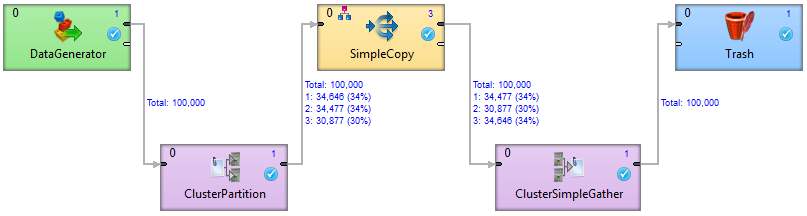
Figure 27.2. An example of a medium level of tracking information
The example above shows a simple clustered graph with a medium level of tracking information. The DataGenerator and ParallelPartition components are executed on a single worker so the interconnecting edge is decorated only by the total number of transferred records. On the output side of ParallelPartition component there is a partitioned edge, since the SimpleCopy component is executed three times. The label above this edge shows that 30% of the data records are sent to one instance of SimpleCopy and 34% to the other two instances.
The high level shows the most detailed information - the number of transferred records and cluster node names where the partition is running (for example 'node1: 250 123'). Partitions where the edge is remote, the source cluster node and target cluster node are shown (for example 'node1~node2: 250 123')
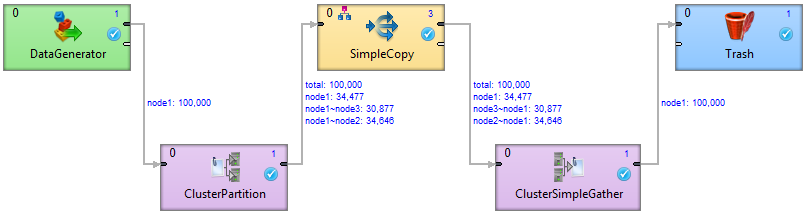
Figure 27.3. An example of a high level tracking information
The example above shows a simple clustered graph with a high level of tracking information. The ParallelPartition component sends data to three different instances of the SimpleCopy component. The first instance runs on the same worker as the ParallelPartition component, so no remote edge is necessary (34,477 records have been transferred locally). The second and third instance run on different workers (and even different cluster nodes). So 34,646 records have been moved from node1 to node2 and 30,877 records have been transferred to node3.