ProfilerProbe
CloverETL Data Quality
Licensed under CloverETL Data Quality package (see Product Comparison).

| Short Description |
| Ports |
| ProfilerProbe Attributes |
| Details |
| Compatibility |
| Troubleshooting |
| See also |
Short Description
ProfilerProbe analyses (profiles) input data. The big advantage of the component is the combined power of CloverETL solutions with data profiling features. Thus, it makes profiling accessible in very complex workflows, such as data integration, data cleansing, and other ETL tasks.
ProfilerProbe is not limited to only profiling isolated data sources; instead, it can be used for profiling data from various sources (including popular DBs, flat files, spreadsheets etc.). ProfilerProbe is capable of handling all data sources supported by CloverETL's Readers.
![[Note]](figures/note.png) | Note |
|---|---|
To be able to use this component, you need a separate Data Quality license. |
| Component | Same input metadata | Sorted inputs | Inputs | Outputs | Each to all outputs | Java | CTL | Auto-propagated metadata |
|---|---|---|---|---|---|---|---|---|
| ProfilerProbe | - |  | 1 | 1-n |  | | | |
Icon
Ports
| Port type | Number | Required | Description | Metadata |
|---|---|---|---|---|
| Input | 0 | | Input data records to be analysed by metrics. | Any |
| Output | 0 | | A copy of input data records. | Input port 0 |
| 1-n | | Results of data profiling per individual field. | Any |
Metadata
ProfilerProbe propagates metadata from first input port to first output ports and from first output port to first input port.
ProfilerProbe does not change the priority of propagated metadata.
If any metric is set up in the component, the component has a template ProfilerProbe_RunResults on it's second output port. The field names and data types depend on used metrics.
ProfilerProbe Attributes
| Attribute | Req | Description | Possible values |
|---|---|---|---|
| Basic | |||
| Metrics | [1] | Statistics you want to be calculated on metadata fields. You can apply all metrics as in standalone Profiler jobs. Learn more about metrics here. | List of all metrics |
| Output mapping | [2] | Maps profiling results to output ports, starting from port number 1. See Details. | |
| Advanced | |||
| Metrics URL | [1] | Profiler job file containing the Metrics settings. | *.cpj |
| Output mapping URL | [2] | External XML file containing the Output mapping definition. | |
| Processing mode |
| Always active (default) | Debug mode only | |
| Persist results |
In Server environment, the profiling results will also be stored to the profiling results database. This can be switched off, by setting this attribute to false. | true (default) | false | |
| Job UUID | Set up this field if you need to have results re-sorted in a reporting console under this UUID. This field is useful in case of moving the ProfilerProbe component to other graph. If you set up this attribute to the value of original UUID, the results in reporting console would continue using the same UUID. Otherwise new UUID would be generated. | ||
[1] Specify only one of these attributes. (If both are set, Metrics URL has a higher priority.) [2] Specify only one of these attributes. (If both are set, Output mapping URL has a higher priority.) | |||
Details
ProfilerProbe calculates metrics of the data that is coming through its first input port. You can choose which metrics you want to apply on each field of the input metadata. You can use this component as a 'probe on an edge' to get a more detailed (statistical) view of data that is flowing in your graph.
The component sends an exact copy of the input data to output port 0 (behaves as SimpleCopy). That means you can use ProfilerProbe in your graphs to examine data flowing in it - without affecting the graph's business logic itself.
The remaining output ports contain results of profiling, i.e. metric values for individual fields.
Output mapping
Editing the Output mapping attribute opens the Transform Editor where you can decide which metrics to send to output ports.
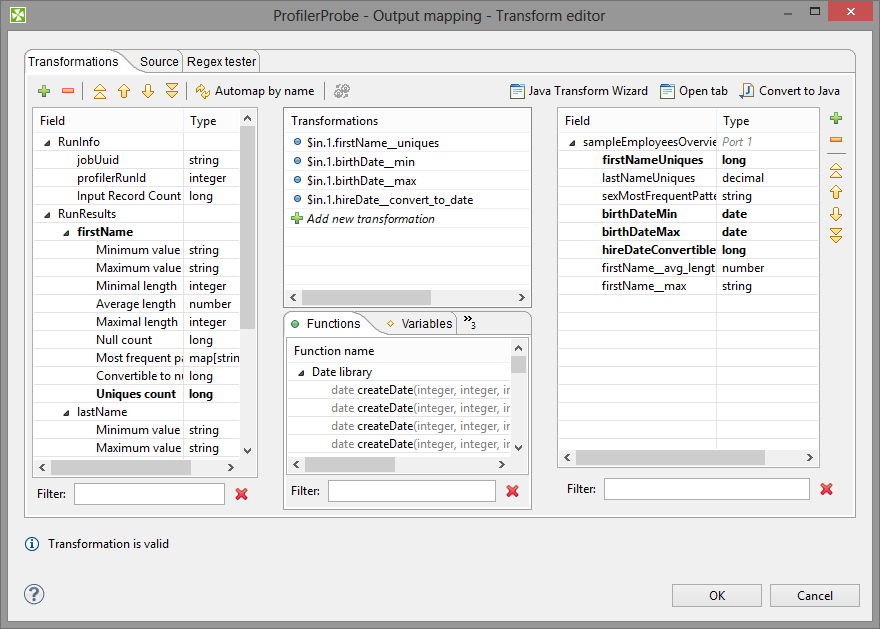 |
Figure 55.6. Transform Editor in ProfilerProbe
The dialog provides you with all the power and features known
from Transform Editor and CTL.
In addition, notice metadata on the left hand side has a special format.
It is a tree of input fields AND metrics you assigned to them via the
Metrics attribute.
Fields and metrics are grouped under the RunResults record.
Each field in RunResults record has a special name:
fieldName__metric_name (note the underscore is doubled as
a separator), e.g. firstName__avg_length.
Additionally there is another special record
containing three fields - JobUid,
inputRecordCount and profilerRunId.
After you run your graph, the field will store the total number of
records which were profiled by the component.
You can right-click a field/metric and Expand All, or
Collapse All metrics.
To do the mapping in a few basic steps:
Provided you already have some output metadata, just left-click a metric in the left-hand pane and drag it onto an output field. This will send profiling results of that particular metric to the output.
If you do not have any output metadata:
Drag a Field from the left hand side pane and drop it into the right hand pane (an empty space).
This produces a new field in the output metadata. Its format is:
fieldName__metric_name(note the underscore is doubled as a separator), e.g.firstName__avg_length.You can map metrics to fields of any output port, except for port 0. That port is reserved for input data (which just 'flows through' the component without being affected in a way).
| Note |
|---|---|
Output mapping uses CTL (you can switch to the Source tab). All kinds of functions are available that help you learn even more about your data. Example:
double uniques = $out.0.firstName__uniques; // conversion from integer
double uniqInAll = (uniques / $in.0.recordCount) * 100;
calculates the per cent of unique first names in all records. |
If you do not define output mapping, the default output mapping is used:
$out.0.* = $in.0.*;
The default output mapping is available since version 4.1.0.
Importing and Externalizing metrics
In the Metrics dialog, you can have your settings of fields and their metrics externalized to a Profiler job (*.cpj) file, or imported from a Profiler job (*.cpj) file into this attribute. There are two buttons at the bottom of the dialog for this purpose: Import from .cpj and Externalize to .cpj. The externalized .cpj file can be used in the Metrics URL attribute. The Externalize to .cpj action fills in this attribute automatically
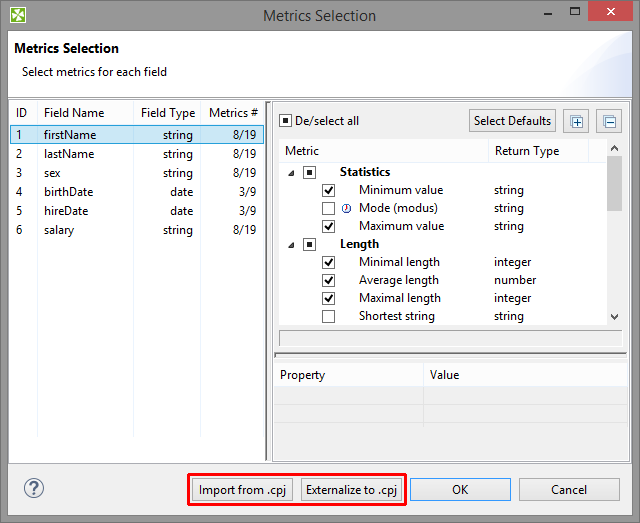 |
Figure 55.7. Import/Externalize metrics buttons
ProfilerProbe Notes & Limitations
This short section describes the main differences between using
the ProfilerProbe component
and profiling data via *.cpj jobs.
It performs analyses just on the data which comes through its input edge. Profiling results are sent to output ports. Please note you do not need any results database. In server environment, the component will send the results also to the profiling results database. Such results can further be viewed using the CloverETL Data Profiler Reporting Console.
It is able to use data profiling jobs
(*.cpj)via the Metrics URL attribute.If you want to use sampling of the input data, connect the DataSampler (or other filter) component to your graph. There is no built-in sampling in ProfilerProbe.
In cluster environment, the component will profile data from each node where it is running. Therefore, the results are only applicable to the portions of data processed on given node. If you need to compute metrics for data from all nodes, first gather the data to single node where this component will run (e.g. by using ParallelSimpleGather). Note: in case the component is running on multiple nodes, it will also produce multiple run results in the profiling results database, each of them applicable only to the portion of data processed on each single node. Typically, for cluster environment, you may therefore wish to turn off the persist results feature.
Compatibility
Default mapping is available since version 4.1.0.
Troubleshooting
The ProfilerProbe component can report an error similar to:
CTL code compilation finished with 1 errors
Error: Line 5 column 23 - Line 5 column 39: Field 'field1__avg_length' does not exist in record 'RunResults'!
This means that you're accessing a disabled metric in output mapping - in this example
the Average length is not enabled on the field field1.