SpreadsheetDataReader
Available in Community Designer

| Short Description |
| Ports |
| Metadata |
| SpreadsheetDataReader Attributes |
| Details |
| Compatibility |
| See also |
Short Description
SpreadsheetDataReader reads data from Excel spreadsheets (XLS or XLSX files).
| Component | Data source | Input ports | Output ports | Each to all outputs | Different to different outputs | Transformation | Transf. req. | Java | CTL | Auto-propagated metadata |
|---|---|---|---|---|---|---|---|---|---|---|
| SpreadsheetDataReader | XLS(X) file | 0–1 | 1–2 |  |  | | | | | |
Icon
Ports
| Port type | Number | Required | Description | Metadata |
|---|---|---|---|---|
| Input | 0 | | For optional port reading. See Reading from Input Port . |
One field (byte, cbyte).
|
| Output | 0 | | Successfully read records | Any |
| 1 | | Error records | Fixed default fields + optional fields from port 0 [1] | |
[1] Records which could not be read correctly are sent to
output port 1 if Data Policy is set to
Controlled and the port has an edge connected
(without the edge, messages are logged to the console).
There is a fixed set of fields describing the reason and position of
the error which caused the record to fail. Additionally,
you can map any field from port 0 as well.
Please note: for each error in the input there is one
error record generated. That is for multiple errors in one record
you get multiple error records – you can group them
e.g. by the very first | ||||
This component has Metadata Templates available.
Metadata
Propagation
SpreadsheetDataReader does not propagate metadata.
Templates
SpreadsheetDataReader has metadata template on error port.
Table 48.13. Error Port Metadata - first ten fields have mandatory types, names can be arbitrary
| Field number | Field name | Data type | Description |
|---|---|---|---|
| 1 | recordID | integer | index of the incorrectly read record (record numbering starts at 1) |
| 2 | file | string | name of the file (if available) the error occurred in |
| 3 | sheet | string | name of the sheet the error occurred in |
| 4 | fieldIndex | integer | index (zero-based) of the field data could not be read into |
| 5 | fieldName | string | name of the field data could not be read into; example: "CustomerID" |
| 6 | cellCoords | string | coordinates of the cell in the source spreadsheet which caused errors on reading; example: "D7" |
| 7 | cellValue | string | value of the cell which caused errors on reading, example: "-5.12" |
| 8 | cellType | string | Excel type of the cell which caused reading errors, example: "String" |
| 9 | cellFormat | string | Excel format string of the cell which caused reading errors, example: "#,##0" |
| 10 | message | string | error message in a human readable format, example: "Cannot get Date value from cell of type String in C1" |
Autofilling Functions
Metadata can use Autofilling Functions.
Note: source_timestamp and source_size
functions work only when reading from a file directly.
If the file is an archive or it is stored in a remote location,
timestamp will be empty and size will be 0.
SpreadsheetDataReader Attributes
| Attribute | Req | Description | Possible values |
|---|---|---|---|
| Basic | |||
| File URL | yes | Specifies the data source(s) that will be read See Supported File URL Formats for Readers. | |
| Sheet |
Name or number (zero-based) of the sheet to be read. You can specify multiple sheets
separated by a semicolon ";".
You can also use the
?
and
*
wildcards to specify multiple sheets. Sheets are then read sequentially one after
another using the same mapping.
| 0 (read the first sheet) | |
| Mapping | [1] | Maps spreadsheet cells to Clover fields in a visual mapping editor. See Details. | |
| Mapping URL | [1] | Path to an XML file containing your Mapping definition. Put your mapping to an external file if you want to share a single mapping among multiple graphs. | |
| Data policy | Determines what is done when an error occurs. See Data Policy for more information. | Strict (default) | Controlled | Lenient | |
| Advanced | |||
| Read mode |
Determines how data is read from the input file. In-memory mode stores the whole input file in memory allowing for faster reading. Suitable for smaller files. In "streaming" mode the file is being read directly without storing in memory. Streaming should thus allow you to read bigger files without running out of memory. Streaming supports both XLS and XLSX. | In memory (default) | Stream | |
| Number of skipped records | Total number of records throughout all source files that will be skipped. See Selecting Input Records . | 0–N | |
| Max number of records | Total number of records throughout all source files that will be read. See Selecting Input Records . | 0–N | |
| Number of skipped records per source | Number of records to be skipped in each source file. See Selecting Input Records . | Same as in Metadata (default) | 0–N | |
| Max number of records per source | Maximum number of records to be read from each source file. See Selecting Input Records . | 0–N | |
| Number of skipped records per spreadsheet | Number of records to be skipped in each Excel sheet. | ||
| Max number of records per spreadsheet | Maximum number of records to be read from each Excel sheet. | ||
| Max error count |
Maximum number of allowed errors
before the graph fails.
Applies
for the
Controlled
value of
Data
Policy.
| 0 (default) | 1–N | |
| Incremental file | [2] | Name of a file storing the incremental key (including path). See Incremental Reading . | |
| Incremental key | [2] | Stores the position of the last record read. See Incremental Reading . | |
| Encryption password | If data are encrypted in the source spreadsheet, type password in here. Mind typing all characters precisely, including the letter case, special characters, accented letters etc. | ||
[1] One of these two has to be specified to define the mapping. [2] Either both or none of these attributes has to be specified. | |||
Details
| Introduction to Spreadsheet Mapping |
| Mapping Editor |
| Metadata |
| Basic Mapping Example |
| Advanced mapping options |
SpreadsheetDataReader reads data from a specified sheet(s) of XLS or XLSX files. It lets you create complex data mapping: forms, tables, multirow records, etc.
Supported File Formats
XLS: only Excel 97/2003 XLS files are supported (BIFF8)
XLSX: Open Document Format, Microsoft Excel 2007 and newer
In XLSX, even files with more than 1,048,576 rows can be read although the XLSX format does not officially support it. (Excel will show no more than 2^20 rows.)
Introduction to Spreadsheet Mapping
A mapping is a universal pattern guiding the component how to read an Excel spreadsheet. The mapping editor always previews spreadsheets of one file but the mapping can be applied to a whole group of similar files.
Each cell can be mapped to a Clover field in one of the following modes:
Map by order
Spreadsheet cells are mapped one by one to output fields in the same order as on the input. If you select another metadata, the cells will be remapped automatically to the new fields.
Map by name
Content is mapped to the record field with same name or label. For each mapped leading cell, the component reads its contents (string) and tries to find a matching field with the same name or label (see Field Name vs. Label vs. Description).
Fields that could not be mapped to the current file are marked as unresolved. You can either map these explicitly, unmap them or modify output metadata.
Note that unresolved cells are not a bad thing – you might read say a group of similar input files, each containing just a subset of possible columns. Mappings with unresolved cells do not result in your graph failing on execution.
![[Note]](figures/note.png)
Note Both Map by order and Map by name modes try to automatically map the contents of the input file to the output metadata. Thus these modes are useful in cases when you read multiple source files and you want to design a single "one-fits-all" generic mapping.
Explicit
In Explicit mapping, you explicitly decide which cells are mapped to which record fields.
This way, you can have e.g. a whole sheet mapped by order with only one cell, which does not fit the mapping, mapped explicitly to a correct field.
To use explicit mapping go to Selected cells and fill in Field name or index with the target field.
If a cell is not mapped yet, you might need to switch Mapping mode to Explicit, first. You can also explicitly map a cell to a field by dragging the field from metadata viewer onto the cell. Opposite direction also works (dragging a cell to a field), but you have to first click the cell to select it, because only selected cell can be dragged. Note that you can drag-and-drop more fields/cells at once.
Auto
In auto mapping, the first spreadsheet row is whole mapped by name with data offset equal to 1.
The auto mapping is used, if you leave all the Mapping component property completely blank.
Another type of auto mapping is created when you map no cell in the mapping editor, but confirm the mapping by clicking OK button. Then, only basic mapping properties will be stored in the Mapping attribute. This way you can change default Rows per record or Data offset used by the basic implicit mapping mentioned above (if default offset is set to 0, mapping by name is used instead of mapping by name).
Alternatively, by switching the reading Orientation property, the first column gets implicitly mapped instead of the first row.
Colours in Spreadsheet Mapping Editor
Orange cells are called leading cells and they form the header. They are a place where a number of mapping settings can be made, see Advanced mapping options.
Yellow cells indicate the beginning of the first record.
Cells in dashed border, which appear after a leading cell is selected, indicate the area data is taken from.
Mapping Editor
The Mapping Editor lets you map spreadsheet rows or columns to metadata fields.
Fill in the File URL and Sheet attributes before opening the Mapping editor. After that, edit Mapping to open a visual mapping editor. It will preview the sheet you have selected:
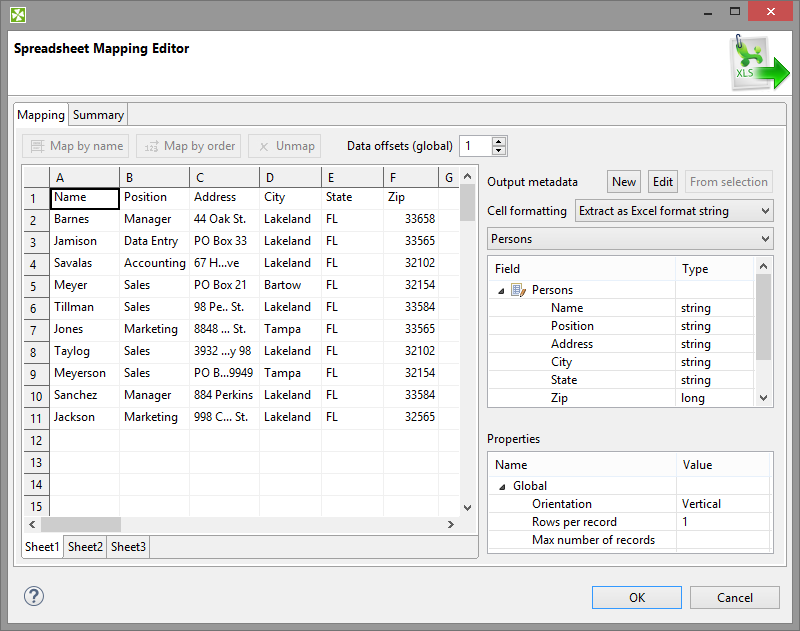 |
Figure 48.12. SpreadsheetDataReader Mapping Editor
The Mapping editor consists of these elements:
Toolbar – buttons controlling how you Map your Excel data (either by order, or by name) and global data offset control (see Advanced mapping options for an explanation of data offsets).
Sheet preview area – this is where you will do and see all the mapping of the source file.
Output metadata – Clover fields you will map Excel cells to.
Properties – either for the whole source file (Global) or just the ones concerning Selected cells
Summary tab – a place where you can neatly review the whole spreadsheet-to-clover mapping you have made.
Metadata
Before you start reading a spreadsheet, you might need to extract its metadata as Clover fields (see Extracting Metadata from an XLS(X) File). Note that the extracting wizard resembles the spreadsheet Mapping editor introduced here and it uses the same principle.
| Note |
|---|---|
You can use the mapping editor to extract metadata right in place without needing to jump to the metadata extract wizard (which is suitable if you need to get just the spreadsheet metadata). |
Metadata assigned to the outgoing edge can be edited in the Output metadata area. You can create and manipulate metadata right from the mapping editor, even if you have not connected an output edge (it is created automatically once you create some fields). Available operations include:
Select existing metadata in the graph using the Output metadata combo.
Create new metadata using the <new metadata> option in the Output metadata combo.
Double click a Field to rename it.
Change data Type via combo-boxes.
For more operations on the output metadata use the Edit button.
To create metadata, drag cells from the spreadsheet preview area and drop them between output metadata fields.
Basic Mapping Example
Typically, your Excel data contains headers in the first row and, thus, can be easily mapped. This section describes how to do that.
First, make sure you have set Vertical mode in → → . This makes SpreadsheetDataReader process the input by rows (opposite to Horizontal orientation, where reading advances by columns).
Optional (in case you have not extracted metadata as in Extracting Metadata from an XLS(X) File): select the first row and drag its fields to the Output metadata pane. This will create fields for all cells in the selection. Types will be guessed automatically, but it is worth checking them yourself afterwards.
Select the whole first row (by clicking the "1" row header) and click either Map by order or Map by name (for explanation, see Introduction to Spreadsheet Mapping).
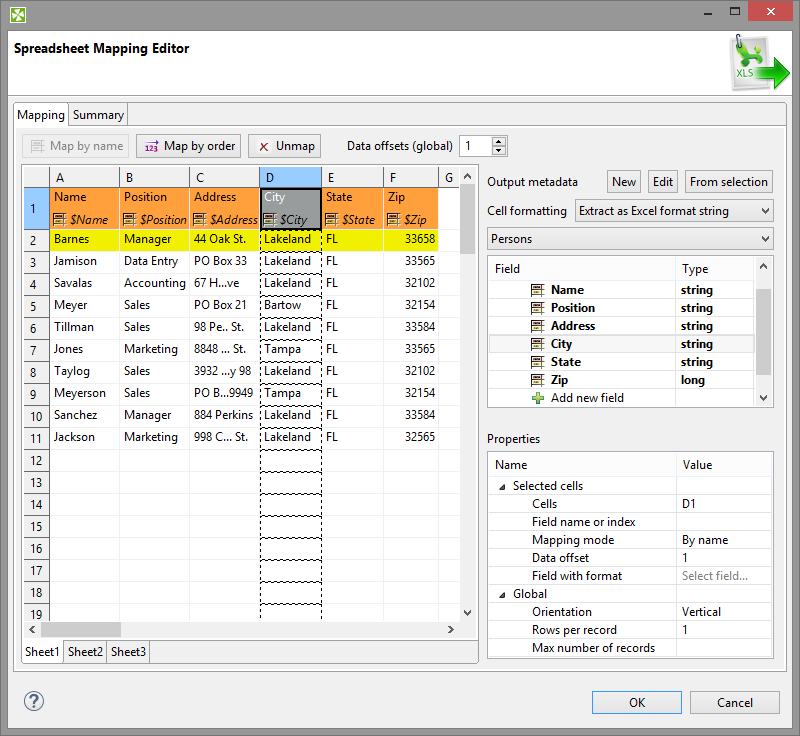
Figure 48.13. Basic Mapping – notice leading cells and dashed borders marking the area data will be taken from
Advanced mapping options
This section provides an explanation of some more concepts extending the Basic Mapping Example
Data offsets (global)
Data offsets (global) determines where data is taken from. Basically, its value represents 'a number of rows (in vertical mode) or columns (in horizontal mode) to be omitted - relative to the leading cell (the orange one)'.
Click the arrow buttons in the top right corner to adjust data offsets for the whole spreadsheet. Additionally, you can click the spinner
 in the
Selected cells area of each leading cell (the orange one) to adjust data
offset locally, i.e. for a particular column only.
in the
Selected cells area of each leading cell (the orange one) to adjust data
offset locally, i.e. for a particular column only.
Notice how modifying data offset is visualized in the sheet preview – the 'omitted' rows change colour. By following dashed cells, which appear when you click a leading cell, you can quickly state where your record will start at.
![[Tip]](figures/tip.png)
Tip The arrow buttons in Data offsets (global) only shift the data offset property of each cell either up or down. So mixed offsets are retained, just shifted as desired. To set all data offsets to a single value, enter the value into the number field of Data offsets (global). Note that if there are some mixed offsets, the value is displayed in gray.
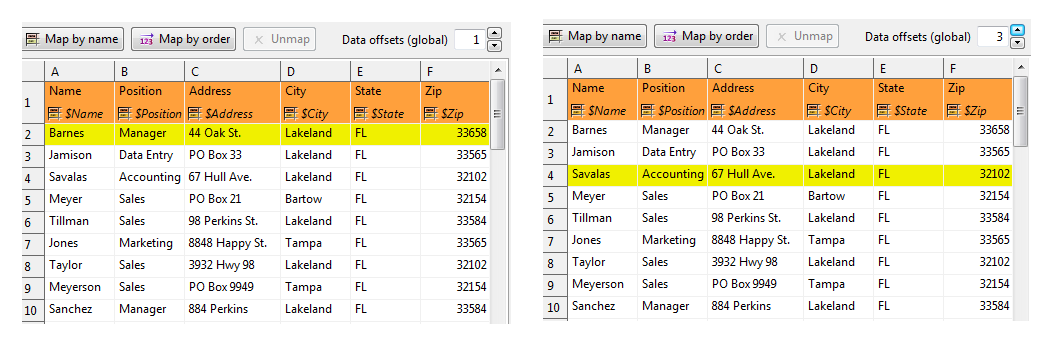
Figure 48.14. The difference between global data offsets set to 1 (default) and 3. In the right hand figure, reading would start at row 4 (ignoring data in rows 2 and 3).
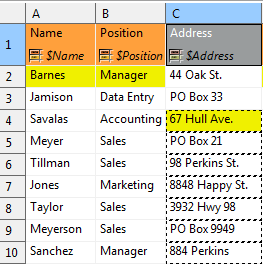
Figure 48.15. Global data offset is set to 1 to all columns. In the third column, it is locally changed to 3.
Rows per record
Rows per record is a Global property specifying how many rows form one record. Best imagined if you look at the figure below:
Figure 48.16. Rows per record is set to 4. This makes SpreadsheetDataReader take 4 Excel rows and create one record out of their cells. Cells actually becoming fields of a record are marked by a dashed border, therefore the record is not populated by all data. Which cells populate a record is also determined by the data offsets setting, see the following bullet point.
Combination of Data offsets and Rows per record
Combination of Data offsets (global and local) and Rows per record – you can put the settings described in preceding bullet points together. See example:
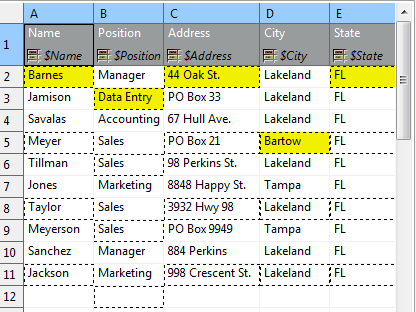
Figure 48.17. Rows per record is set to 3. The first and third columns 'contribute' to the record by their first row (because of the global data offset being 1). The second and fourth columns have (local) data offsets 2 and 4, respectively. The first record will, thus, be formed by 'zig-zagged' cells (the yellow ones – follow them to make sure you understand this concept clearly).
Max number of records
Max number of records is a Global property which you can specify via component attributes, too (see SpreadsheetDataReader Attributes). If you reduce it, you will notice the number of dashed cells in the spreadsheet preview reduces as well (highlighting only the cells which will be mapped to records in fact).
Format Field
Excel format (as in Excel's right-click menu – Format Cells) can be retrieved from read cells. Select a leading cell and specify the Format Field property (in Selected cells) as a target field to which the format patterns will be read. Keep in mind the target field has to be
string. You can use this approach even if read data cells have various formats (e.g. various currencies).Note If an Excel cell has the
Generalformat, which is a common case, the format cannot be transferred to Clover due to an internal Excel formatting. Instead, the target field will bear a string "General".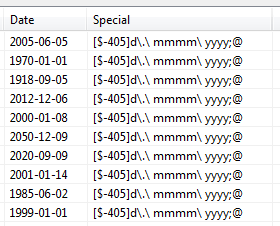
Figure 48.18. Retrieving format from a date field. Format Field was set to the "Special" field as target.
Formats can also be extracted during the one-time metadata extraction process. In metadata, format is taken from a single cell which you supply as a sample value to the metadata extraction wizard. See Extracting Metadata from an XLS(X) File.
If a cell has its format specified by the Excel format string (
excel:), SpreadsheetDataReader can read it back. Other readers would ignore it. For further reading on format strings, see Formatting cells (Field with format).Multiple leading cells per column
In some spreadsheets, data in one column gets mixed, but you still need to process it all into one record. For example, imagine a column containing first names in odd rows and surnames in even rows one after another. In that case, you will create two leading cells above each other to be able to read both the first names and surnames. Remember to set Rows per record to an appropriate value (2 in this example) not to read same data in all leading cells. Also, mind raising Data offset in the upper leading cell to start reading data where it truly begins. Look at the figure below:
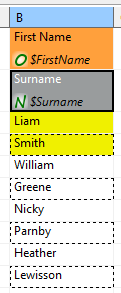
Figure 48.19. Reading mixed data using two leading cells per column. Rows per record is 2, Data offset needed to be raised to 2 – looking at the first leading cell which has to start reading on the third row.
Notes and Limitations
Invalid mapping
It is possible to create invalid mapping using the mapping editor. Invalid mapping causes SpreadsheetDataReader to fail. Such a mapping arises when, for example, one metadata field is mapped to more than one cell, or an autofilled field is mapped (see Autofilling Functions). Another invalid mapping would be caused by an attempt to read a cell (at least one) into more than one metadata field.
When you change mapping in any way, the validation process is automatically run and you will see the warning icon with cell(s) and/or metadata field(s) which cause the mapping to be invalid. When you mouse over such a cell or field, a tooltip with information about the validation problem will be displayed. Also, one of the warning validation messages is displayed at the top of the editor (the white header area).
Note that warnings caused by cells mapped by name/order will not necessarily lead to the component's failure (as mentioned earlier).
Reading date as string
SpreadsheetDataReader cannot guarantee that dates read into
stringfields will be displayed identically to how they appear in MS Excel. The reason is Clover interprets the format string stored in a cell otherwise than Excel - it depends on your locale.![[Important]](figures/important.png)
Important It is recommend you read dates into
datefields and convert them tostringusing a CTL transformation.Built-in Excel formats are interpreted according to the following table:
Table 48.14. Format strings
Format index stored in Excel cell Format string 0 "General" 1 "0" 2 "0.00" 3 "#,##0" 4 "#,##0.00" 5 "$#,##0_);($#,##0)" 6 "$#,##0_);[Red]($#,##0)" 7 "$#,##0.00);($#,##0.00)" 8 "$#,##0.00_);[Red]($#,##0.00)" 9 "0%" 0xa "0.00%" 0xb "0.00E+00" 0xc "# ?/?" 0xd "# ??/??" 0xe "m/d/yy" 0xf "d-mmm-yy" 0x10 "d-mmm" 0x11 "mmm-yy" 0x12 "h:mm AM/PM" 0x13 "h:mm:ss AM/PM" 0x14 "h:mm" 0x15 "h:mm:ss" 0x16 "m/d/yy h:mm" 0x25 "#,##0_);(#,##0)" 0x26 "#,##0_);[Red](#,##0)" 0x27 "#,##0.00_);(#,##0.00)" 0x28 "#,##0.00_);[Red](#,##0.00)" 0x29 "_(*#,##0_);_(*(#,##0);_(* \"-\"_);_(@_)" 0x2a "_($*#,##0_);_($*(#,##0);_($* \"-\"_);_(@_)" 0x2b "_(*#,##0.00_);_(*(#,##0.00);_(*\"-\"??_);_(@_)" 0x2c "_($*#,##0.00_);_($*(#,##0.00);_($*\"-\"??_);_(@_)" 0x2d "mm:ss" 0x2e "[h]:mm:ss" 0x2f "mm:ss.0" 0x30 "##0.0E+0" 0x31 "@" (this is text format) Custom format strings are read as they are defined in Excel. Decimal point is modified according to your locale. Special characters such as double quotes are not interpreted at all.
In both cases (built-in and custom formats), the result may vary from how Excel displays it.
Reading raw values
To read numbers from .xls(x) files with the full precision available, set format of the metadata string field to excel:raw. See String Format.
When SpreadsheetDataReader reads a value from workbook to a string field with excel:raw format, it tries to extract the raw value from workbook. This has, e.g., the following consequences:
Full precision of numbers is accessible workbook for both: XLS and XLSX.
Raw representation of dates is available; they are extracted as they are in the workbook - i.e. numbers (both XLS and XLSX)
Boolean cell values can be retrieved as their xlsx representation - i.e.
0and1.
The only exception are shared strings. The referenced string is returned even with excel:raw format instead of the raw value (the index of the string in the shared strings table).
SpreadsheetDataWriter ignores excel:raw format. When it's set, the component acts as if the format property is empty.
Examples
Mapping Fields by Order
Read tables with numbers of sold tiles in the first quarter. The tables has the same structure: product name, January, February, March. The company is international. Each affiliate may use a different language, therefore you cannot map fields by name.
Product |January|February|March
T1      |    620|     600|  700
T2      |    150|     150|  100
Producto|Enero  |Febrero |Marzo
T1      |    500|     400|  600
T2      |    300|     400|  500
Solution
Specify attributes: File URL, Sheet, and Mapping.
In Spreadsheet Mapping Editor, map the columns to output metadata fields: select leading cells (the first four cells in the first row) and click Map by order.
Compatibility
4.0.0-M2
SpreadsheetDataWriter is not a commercial component since CloverETL version 4.0.0-M2.
4.1.2
Since 4.1.2 you can read strings to excel:raw format.
4.4.0-M2
Since 4.4.0-M2, SpreadsheetDataReader can read from input port just from byte or cbyte field.