Selecting Debug Data
By default, the first 1000 records going through debugged edges are saved to debug files. The exception are graphs running on server via automated process (e.g.: scheduling, listening) where debugging on edges is disabled by default.
You can restrict the data records that will be saved to debug files. You can set it up in the Properties tab of any debug edge, or you can right-click the debugged edge and set it up in Debug properties accessible from the context menu.
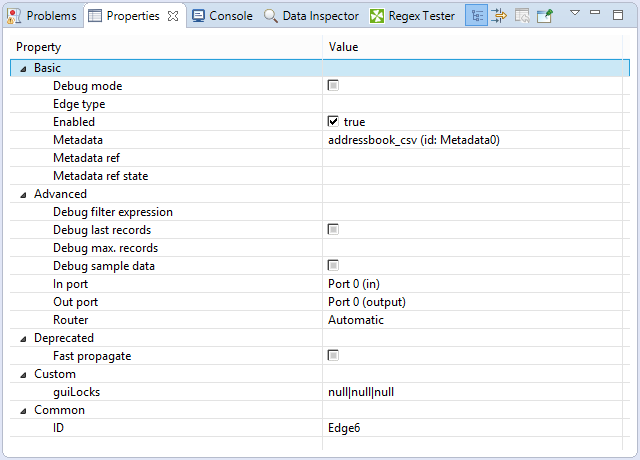
To avoid saving all data records, you can set any of the following four edge attributes either in the Properties tab or in the Debug properties dialog: Debug filter expression, Debug last records, Debug max. records, and Debug sample data.
 |
Figure 31.6. Properties of an Edge
Debug Filter Expression
If you specify a filter expression for an edge, data records that satisfy the specified filter expression will be saved to the debug file. The others that do not satisfy the expression will be ignored.
If a filter expression is defined,
either all records that satisfy the expression
(Debug sample data is set to false) or
only a sample of them (Debug sample data is
set to true) will be saved.
The filter expression is defined with help of Filter Editor.
Filter Editor
 |
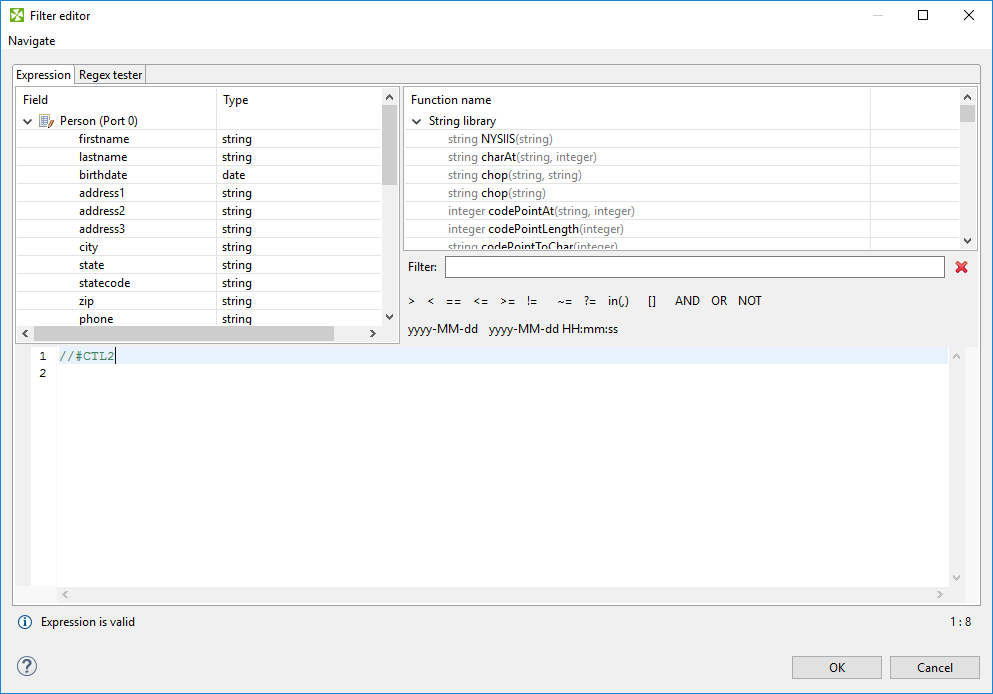
Figure 31.7. Filter Editor
The Filter Editor consists of three panes.
The left one displays a list of record fields, their names and data types. You can select any of record fields by double-clicking or dragging and dropping. Then the field name appears in the bottom area with the port number preceded by dollar sign that are before that name. (For example,
$in.0.street.)
The right pane displays a list of available CTL functions. Below this pane, there are both comparison signs and logical connections. You can select any of the names, functions, signs and connections by double-clicking. After that, they appear in the bottom area.
You can work with functions, operators and fields in the bottom area and complete the creation of the filter expression. The filter expression is validated on the fly.
Example 31.1. Debug filter expression
//#CTL2
isInteger($in.0.field1)
![[Important]](figures/important.png) | Important |
|---|---|
The usage of an old version of CTL (CTL1) is deprecated. Do not use it. |
The Filter Editor is described in documentation on Filter.
Debug Last Records
If you set the Debug last records
property to false,
data records from the beginning will be saved to the debug file.
By default, the records from the end are saved to debug files.
Default value of Debug last records is
true.
Remember that if you set the Debug last records
attribute to false,
data records will be selected from the beginning with greater frequency than from the end.
And, if you set the Debug last records
attribute to true or leave it unchanged,
they will be selected more frequently from the end than from the beginning.
Debug Max. Records
You can also set up a limit on the number of data records that will be saved into a debug file.
These data records will be taken either from the beginning
(Debug last records is set to false)
or from the end (Debug last records has the default
value or it is set to true explicitly).
![[Note]](figures/note.png) | Note |
|---|---|
If the Debug max. records is set up in the Properties tab, all edges of the graph are affected. If the Debug max. records is set up on an edge, only the debugging on the edge is affected. If the property is set up in the Properties tab and on the edge, the value set up on the edge level has higher priority. |
Debug Sample Data
If you set the Debug sample data attribute to true,
the Debug max. records attribute value is only the threshold
that limits how many data records could be saved to a debug file.
Data records will be saved at random, some of them will be omitted, others will be saved to the debug file.
In this case, the number of data records saved to a debug file will be less
than or equal to this limit.
If you do not set any value of Debug sample data, or if you set it to false explicitly,
the number of records saved to the debug file will
be equal to the Debug max. records
attribute value (if more records than Debug max. records go through the debug edge).
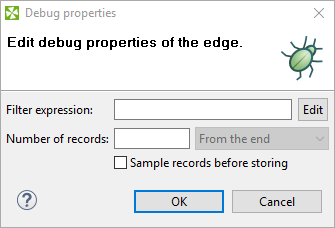
The same properties can also be defined using the context menu by selecting the Debug properties option. After that, the following dialog will open:

Figure 31.8. Debug Properties Dialog