| Documentation | |
|---|---|
19.5. Debugging a ProgramEnterpriseDB PL Debugger can perform the following set of operations to aid with debugging your programs:
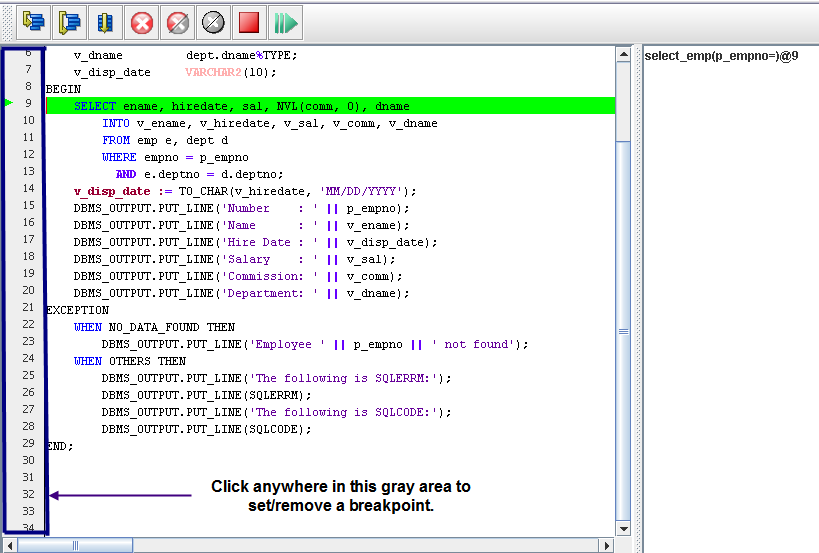
Let us discuss each of these operations individually in the subsequent sections so that you can gain greater understanding about them. 19.5.1. Stepping Through the CodeTo step through the program, choose one of the following commands: Step Into: Moves to the next executing line in the program being debugged. If the line contains a program call, Step Into will step inside that function, and you could see the call stack in the stack frame. Step Into can be performed by clicking on the Step Over: Skips called programs. The program is executed, but the debugger does not step through its code. Instead, the debugger moves to the next line in the current program after executing the called program. Step Over can be performed by clicking on the Continue: Resumes program execution from the line of code in the green highlight bar. PL Debugger stops when a breakpoint is encountered or when it reaches the last executable line in the program. Continue can be performed by clicking on the 19.5.2. Using BreakpointsA breakpoint makes your debugger stop whenever a certain point in the program is reached. EnterpriseDB PL Debugger allows users to set breakpoints. EnterpriseDB supports two types of breakpoints, global and local. Global breakpoints are visible to all the users that access a particular database while the local breakpoints are set locally and are visible only to the user who has set them. Global breakpoints can be set only by a super user, for example a DBA. A user has the option to manipulate local and global breakpoints by directly entering SQL commands using EnterpriseDB PSQL. Both local and global breakpoints can be set on functions, procedures or triggers. 19.5.2.1. Setting BreakpointsBreakpoints can be set by the following ways:
Once a breakpoint has been set successfully a red circle will appear on the left-hand margin. 19.5.2.2. Removing BreakpointsYou can remove a breakpoint from any of the following ways:
19.5.2.3. Removing all Breakpoints:You can remove all breakpoints in a program in the following two ways:
19.5.3. Stopping the PL DebuggerOnce the debugger is started, it can be stopped. You can Stop the debugger by either:
19.5.4. Restarting the PL DebuggerOnce the debugger is started, it can also be restarted. You can Restart the debugger by either:
|