| Documentation | |
|---|---|
19.4. Main Debugger WindowThe Main Debugger Window has three frames - the Program Body Frame, the Call Stack Frame, and the Variable View Frame. In addition, status and error information is displayed in an information bar at the bottom of the Main Debugger Window. The Main Debugger Window appears right after you press the OK button in the Parameter Grid Window. If the program to be debugged does not take input parameters, then the Main Debugger Window is the first window that appears when the PL Debugger is invoked.
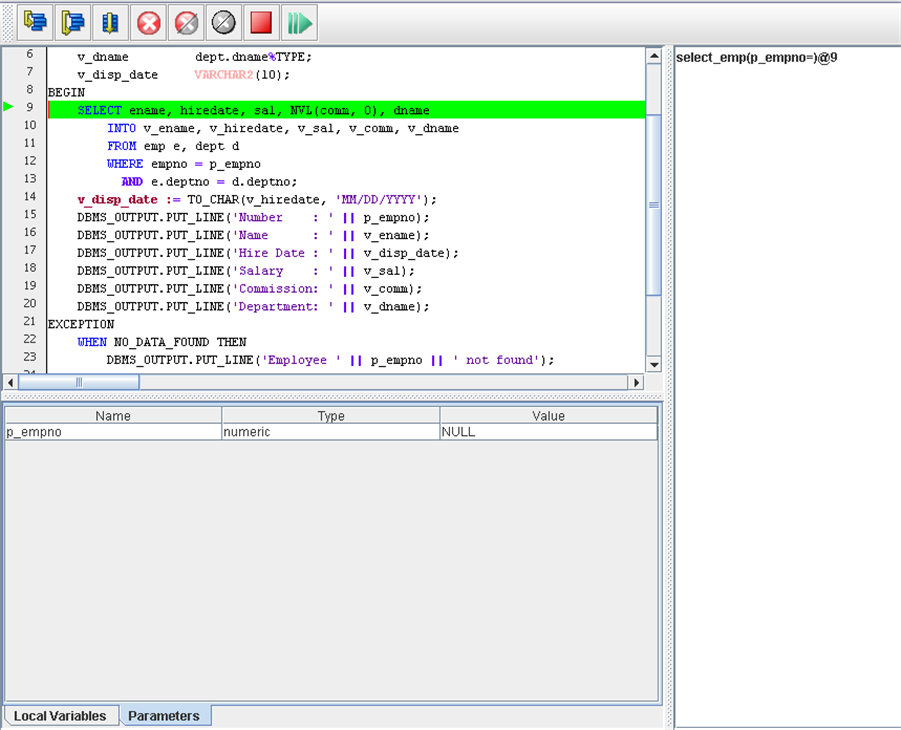
19.4.1. Program Body FrameThe Program Body Frame displays the source code of the program being debugged. A green bar highlights the background of the line of code that will be executed next as shown in the following screenshot. We can see that line number 9 is being currently executed.
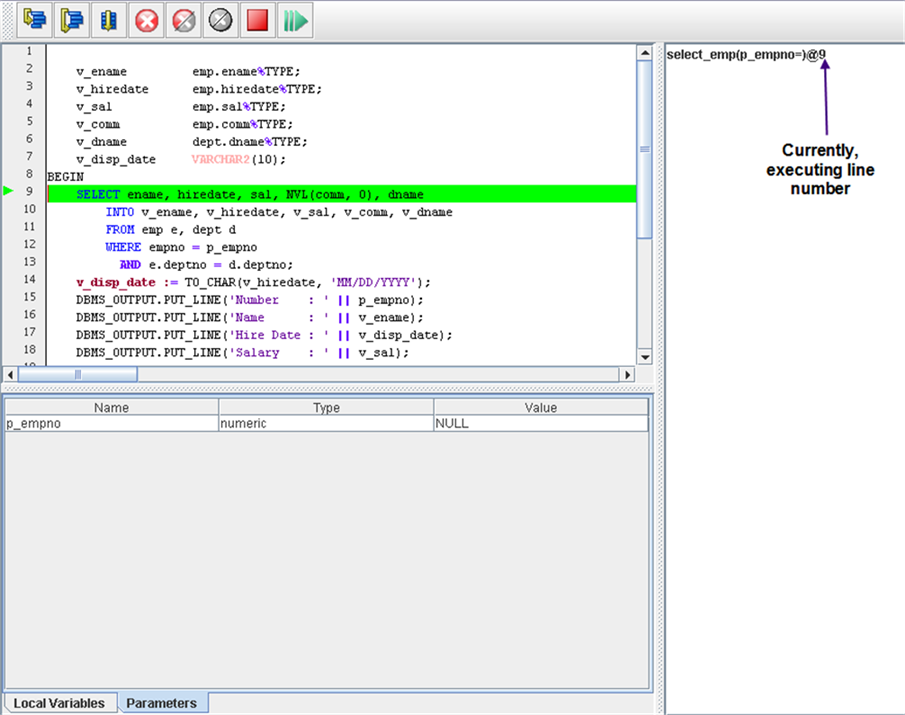
19.4.2. Call Stack FrameWhile debugging, you can see a list of programs that are currently loaded. Each time a program is called, the name of the called program is added to the top of the call stack. When the program ends, its name is removed from the Call Stack Frame. Each time your program performs a program call, information about the call is generated in the Call Stack Frame. That information includes the location of the call in your program, the arguments of the call, and the name of the program being called. Viewing the call stack can help you trace the course of execution through a series of nested programs. You can also use the call stack to navigate within the document to a specific program. When you navigate to another program, you can set breakpoints there, query variable values, and so on. However, using the call stack to navigate to another program does not change the currently executing line. Even if you set a breakpoint or variable value in another program, execution resumes from the line where it was halted. You can query variables for the currently selected program in the call stack.
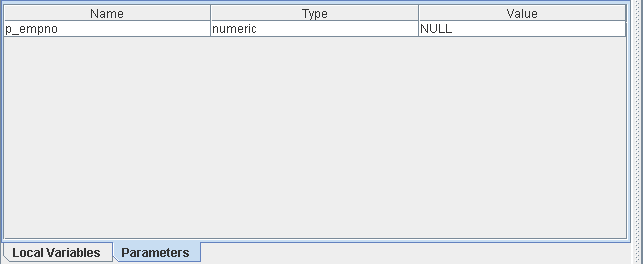
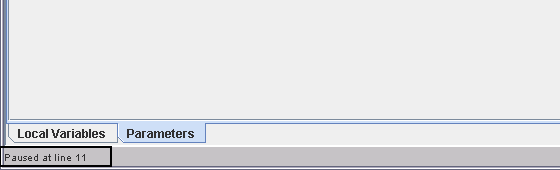
19.4.3. Variable View FrameWhile debugging, you can view and change the values of variables and parameters. The parameters and local variables are accessible from their respective tabs as shown in the example below:
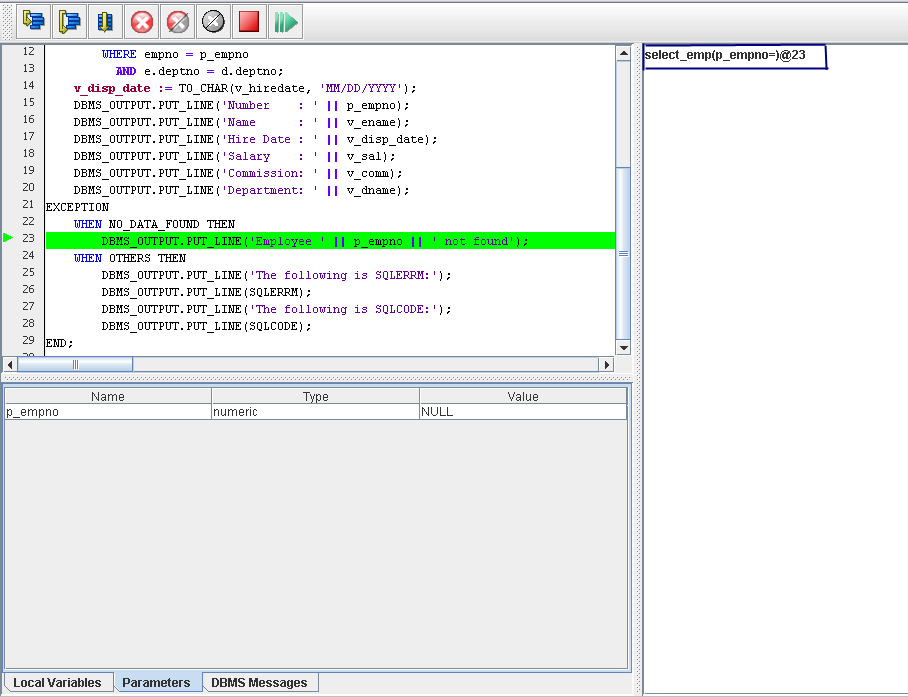
The above example is showing usage of the Variable View Frame for the select_emp procedure which takes only one IN parameter. For other programs which accept multiple parameters, you will be given the option of updating all those paramters in the Variable View Frame. 19.4.4. Information BarThe Information Bar shows displays a message when PL Debugger stops debugging or when any run time error messages are encountered during you debugging session.
|