| Documentation | |
|---|---|
17.5. Visual ExplainEnterpriseDB devises a query plan for each query it is given. Choosing the right plan to match the query structure and the properties of the data is absolutely critical for good performance. For more information see Section 13.2. EnterpriseDB contains Visual Explain. Visual Explain graphically demonstrates the following:
Visual Explain can be invoked by the following two ways:
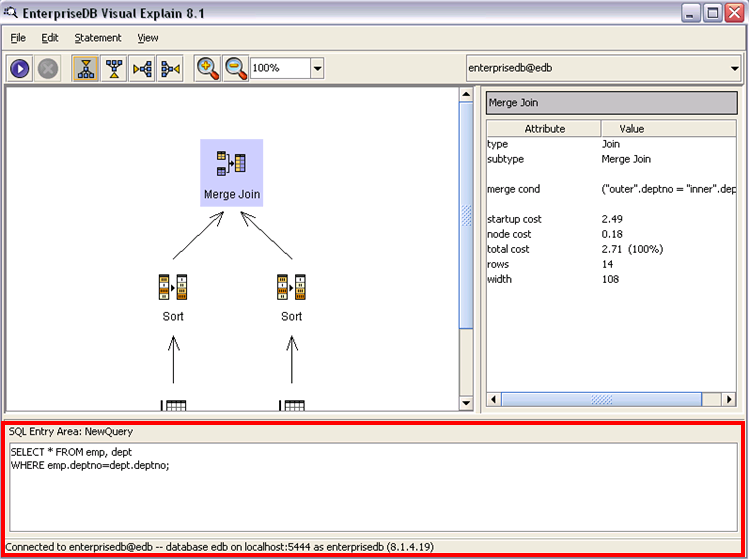
The bottom area of the window is SQL entry area. Here the query is written which is to be explained. The SQL entry area is indicated with red border in the above image. SQL statements can be executed in the following three ways:
Right panel shows us the statistics regarding startup cost, node cost, total cost, rows retrieved and width (in bytes) of rows returned. It also shows us the information in this case regarding the type of join and merge condition. The main window graphically explains the cost of the SQL query. In this example it shows that first sequential scans are run on both tables emp and dept, which are then sorted and merge joined. We can also use the Explain Analyze option. Explain Analyze can be executed in two ways:
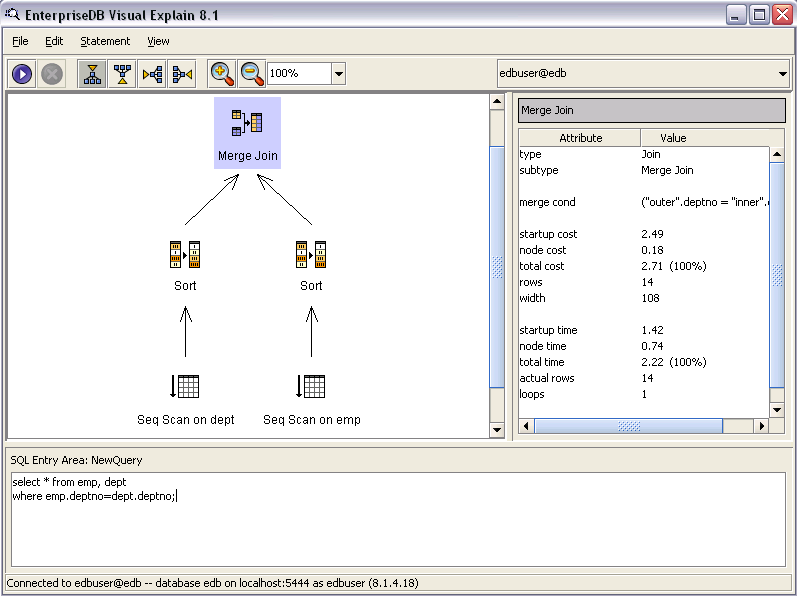
Executing Explain Analyze will show us further details regarding the SQL statement. This includes information like startup time, node time, total time, actual rows and loops. The following image shows the Explain Analyze result.
|