

|
|
|
Once you have installed and configured your replication scheme and propagated it to appropriate databases, you can use the Visual Performance Monitor tool or the Performance Monitor in Visual DBA to monitor your replication activities. Because it is simpler to use, Visual Performance Monitor is the preferred tool for this task.
|
|
|
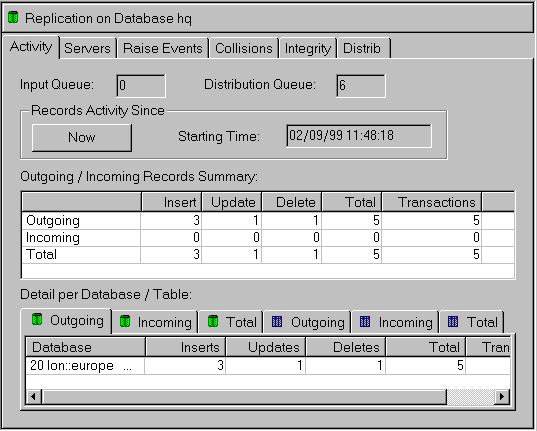
To monitor replication activity for all running servers, view the Performance Monitor Activity page when a database is selected. The Activity page shows the total number of outgoing and incoming records, the total number of transactions associated with the incoming and outgoing records, and the queue activity for each database that the servers support.
Note: The counts of incoming and outgoing records are transient. They show activity only since the time the Performance Monitor was first entered or since the last time the Now button was chosen to reset the Starting Time to the current time in the Records Activity Since group.
The following illustration shows the Activity page in Performance Monitor:
For detailed instructions on performing replication monitoring tasks, see the Visual DBA or Visual Performance Manager online help.
|
|
|
In monitoring replication, you need to check the statuses of the Replicator Servers. You can ping each server to obtain its status using the Servers page in the sub-branches under the Replication branch. For details, see the online help topic, Viewing Replication Server Status.
|
|
|
To issue database events for all servers that are defined for a replication scheme at the database level, view the Raise Events page. For details, see the online help topic, Raising Events at the Database Level. Such events include stopping a server or processing pending replications. To raise an event for an individual server, see Raise Events at the Server Level.
|
|
|
To issue database events for an individual Replicator Server, view the Raise Events page. (For details, see the online help topic, Raising Events at the Server Level.) Such events include stopping a server or processing pending replications. To raise an event for all servers that are defined for a replication scheme at the database level, see Raise Events at the Database Level.
|
|
|
On the Collisions page, you can generate the Queue Collision Report, which lists all collision conflicts that exist on the local database. For details, see the online help topic, Viewing Collision Conflicts. By reviewing this report, you can start the process of resolving the collision.
For sample report output, see Queue Collision Report.
|
|
|
The Integrity page allows you to specify a report to compare a table in two different databases. For details, see the online help topics, Integrity Page and Verifying Table Integrity.
You can specify the criteria for the comparison based on transaction begin and end time, and if desired, a CDDS value to designate a particular distributed data set. You can also specify the sort order of the report by replicated column or transaction time.
For sample report output, see Table Integrity Report Window.
|
|
|
The Distributed Configuration Checker Report is used to verify that a local database's replication configuration and its remote counterparts are consistent with one another. For details, see the online help topic, Distrib Page. The report pinpoints any significant differences between the replication setups of the individual databases.
For a sample of the Distributed Configuration Checker Report output, see Distributed Configuration Checker Report.
Tip: It is recommended that you run this report when problems occur, or periodically, to ensure that the remote configurations have not been changed without authorization.