

Axes.quiver(*args, **kw)¶Plot a 2-D field of arrows.
Call signatures:
quiver(U, V, **kw)
quiver(U, V, C, **kw)
quiver(X, Y, U, V, **kw)
quiver(X, Y, U, V, C, **kw)
U and V are the arrow data, X and Y set the locaiton of the arrows, and C sets the color of the arrows. These arguments may be 1-D or 2-D arrays or sequences.
If X and Y are absent, they will be generated as a uniform grid.
If U and V are 2-D arrays and X and Y are 1-D, and if len(X) and
len(Y) match the column and row dimensions of U, then X and Y will be
expanded with numpy.meshgrid().
The default settings auto-scales the length of the arrows to a reasonable size. To change this behavior see the scale and scale_units kwargs.
The defaults give a slightly swept-back arrow; to make the head a triangle, make headaxislength the same as headlength. To make the arrow more pointed, reduce headwidth or increase headlength and headaxislength. To make the head smaller relative to the shaft, scale down all the head parameters. You will probably do best to leave minshaft alone.
linewidths and edgecolors can be used to customize the arrow outlines.
| Parameters: | X : 1D or 2D array, sequence, optional
Y : 1D or 2D array, sequence, optional
U : 1D or 2D array or masked array, sequence
V : 1D or 2D array or masked array, sequence
C : 1D or 2D array, sequence, optional
units : [ ‘width’ | ‘height’ | ‘dots’ | ‘inches’ | ‘x’ | ‘y’ | ‘xy’ ]
angles : [ ‘uv’ | ‘xy’ ], array, optional
scale : None, float, optional
scale_units : [ ‘width’ | ‘height’ | ‘dots’ | ‘inches’ | ‘x’ | ‘y’ | ‘xy’ ], None, optional
width : scalar, optional
headwidth : scalar, optional
headlength : scalar, optional
headaxislength : scalar, optional
minshaft : scalar, optional
minlength : scalar, optional
pivot : [ ‘tail’ | ‘mid’ | ‘middle’ | ‘tip’ ], optional
color : [ color | color sequence ], optional
|
|---|
See also
quiverkeyNotes
Additional PolyCollection
keyword arguments:
Property Description agg_filterunknown alphafloat or None animated[True | False] antialiasedor antialiasedsBoolean or sequence of booleans arrayunknown axesan Axesinstanceclima length 2 sequence of floats clip_boxa matplotlib.transforms.Bboxinstanceclip_on[True | False] clip_path[ ( Path,Transform) |Patch| None ]cmapa colormap or registered colormap name colormatplotlib color arg or sequence of rgba tuples containsa callable function edgecoloror edgecolorsmatplotlib color spec or sequence of specs facecoloror facecolorsmatplotlib color spec or sequence of specs figurea matplotlib.figure.Figureinstancegidan id string hatch[ ‘/’ | ‘\’ | ‘|’ | ‘-‘ | ‘+’ | ‘x’ | ‘o’ | ‘O’ | ‘.’ | ‘*’ ] labelstring or anything printable with ‘%s’ conversion. linestyleor dashes or linestyles[‘solid’ | ‘dashed’, ‘dashdot’, ‘dotted’ | (offset, on-off-dash-seq) | '-'|'--'|'-.'|':'|'None'|' '|'']linewidthor linewidths or lwfloat or sequence of floats normunknown offset_positionunknown offsetsfloat or sequence of floats path_effectsunknown picker[None|float|boolean|callable] pickradiusunknown rasterized[True | False | None] sketch_paramsunknown snapunknown transformTransforminstanceurla url string urlsunknown visible[True | False] zorderany number
Examples
(Source code, png, pdf)

 in data units
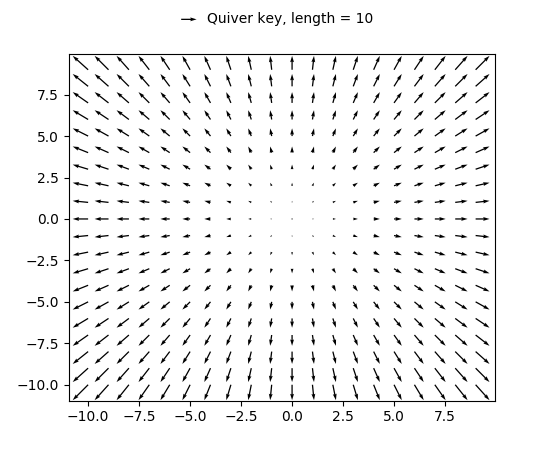