Standard profiler that tracks real time, cpu time, and memory deltas. More...
Public Member Functions | |
| __construct (array $params) | |
| close () | |
| Close opened profiling sections. | |
| getOutput () | |
| Returns a profiling output to be stored in debug file. | |
| getRawData () | |
| isPersistent () | |
| Return whether this profiler stores data. | |
| isStub () | |
| Return whether this a stub profiler. | |
| logData () | |
| Log the data to some store or even the page output. | |
| profileIn ($functionname) | |
| Called by wfProfieIn() | |
| profileOut ($functionname) | |
| Called by wfProfieOut() | |
Protected Member Functions | |
| addInitialStack () | |
| Add the inital item in the stack. | |
| calltreeCount ($stack, $start) | |
| Counts the number of profiled function calls sitting under the given point in the call graph. | |
| collateData () | |
| Populate mCollated. | |
| collateOnly () | |
| Whether to internally just track aggregates and ignore the full stack trace. | |
| getCallTree () | |
| Returns a tree of function call instead of a list of functions. | |
| getCallTreeLine ($entry) | |
| Callback to get a formatted line for the call tree. | |
| getContentType () | |
| Get the content type sent out to the client. | |
| getErrorEntry () | |
| getFunctionReport () | |
| Returns a list of profiled functions. | |
| getZeroEntry () | |
| remapCallTree (array $stack) | |
| Recursive function the format the current profiling array into a tree. | |
| updateEntry ($name, $elapsedCpu, $elapsedReal, $memChange, $subcalls=0, $period=null) | |
| Update the collation entry for a given method name. | |
Static Protected Member Functions | |
| static | calculateOverhead ($profileCount) |
| Dummy calls to wfProfileIn/wfProfileOut to calculate its overhead. | |
Protected Attributes | |
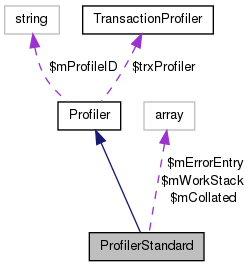
| array | $mCollated = array() |
| Map of (function name => aggregate data array) *. | |
| bool | $mCollateDone = false |
| * | |
| bool | $mCollateOnly = false |
| * | |
| array | $mErrorEntry |
| Cache of a standard broken collation entry *. | |
| $mStack = array() | |
| array | $mWorkStack = array() |
| Queue of open profile calls with start data *. | |
Detailed Description
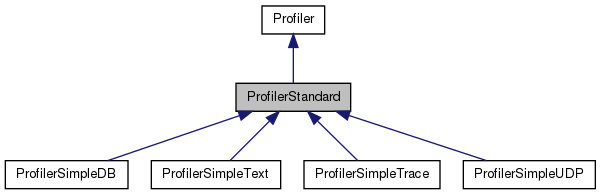
Standard profiler that tracks real time, cpu time, and memory deltas.
This supports profile reports, the debug toolbar, and high-contention DB query warnings. This does not persist the profiling data though.
- Since:
- 1.24
Definition at line 33 of file ProfilerStandard.php.
Constructor & Destructor Documentation
| ProfilerStandard::__construct | ( | array $ | params | ) |
- Parameters:
-
array $params
Reimplemented from Profiler.
Definition at line 46 of file ProfilerStandard.php.
References addInitialStack(), and collateOnly().
Member Function Documentation
| ProfilerStandard::addInitialStack | ( | ) | [protected] |
Add the inital item in the stack.
Definition at line 88 of file ProfilerStandard.php.
Referenced by __construct().
| static ProfilerStandard::calculateOverhead | ( | $ | profileCount | ) | [static, protected] |
Dummy calls to wfProfileIn/wfProfileOut to calculate its overhead.
- Parameters:
-
int $profileCount
Definition at line 515 of file ProfilerStandard.php.
References wfProfileIn(), and wfProfileOut().
| ProfilerStandard::calltreeCount | ( | $ | stack, |
| $ | start | ||
| ) | [protected] |
Counts the number of profiled function calls sitting under the given point in the call graph.
Not the most efficient algo.
- Parameters:
-
array $stack int $start
- Returns:
- int
Definition at line 532 of file ProfilerStandard.php.
Close opened profiling sections.
Reimplemented from Profiler.
Definition at line 250 of file ProfilerStandard.php.
Referenced by ProfilerSimpleUDP\logData(), and ProfilerSimpleText\logData().
| ProfilerStandard::collateData | ( | ) | [protected] |
Populate mCollated.
Definition at line 353 of file ProfilerStandard.php.
Referenced by ProfilerSimpleDB\logData().
| ProfilerStandard::collateOnly | ( | ) | [protected] |
Whether to internally just track aggregates and ignore the full stack trace.
Only doing collation saves memory overhead but limits the use of certain features like that of graph generation for the debug toolbar.
- Returns:
- bool
Reimplemented in ProfilerSimpleText, ProfilerSimpleTrace, ProfilerSimpleUDP, and ProfilerSimpleDB.
Definition at line 81 of file ProfilerStandard.php.
Referenced by __construct().
| ProfilerStandard::getCallTree | ( | ) | [protected] |
Returns a tree of function call instead of a list of functions.
- Returns:
- string
Definition at line 288 of file ProfilerStandard.php.
References array(), and remapCallTree().
| ProfilerStandard::getCallTreeLine | ( | $ | entry | ) | [protected] |
Callback to get a formatted line for the call tree.
- Parameters:
-
array $entry
- Returns:
- string
Definition at line 340 of file ProfilerStandard.php.
| ProfilerStandard::getContentType | ( | ) | [protected] |
Get the content type sent out to the client.
Used for profilers that output instead of store data.
- Returns:
- string
Definition at line 546 of file ProfilerStandard.php.
Referenced by ProfilerSimpleText\logData(), and ProfilerSimpleTrace\logData().
| ProfilerStandard::getErrorEntry | ( | ) | [protected] |
- Returns:
- array Initial collation entry for errors
Definition at line 130 of file ProfilerStandard.php.
| ProfilerStandard::getFunctionReport | ( | ) | [protected] |
Returns a list of profiled functions.
- Returns:
- string
Definition at line 424 of file ProfilerStandard.php.
Returns a profiling output to be stored in debug file.
- Returns:
- string
Reimplemented from Profiler.
Definition at line 268 of file ProfilerStandard.php.
| ProfilerStandard::getZeroEntry | ( | ) | [protected] |
- Returns:
- array Initial collation entry
Definition at line 110 of file ProfilerStandard.php.
Return whether this profiler stores data.
- See also:
- Profiler::logData()
- Returns:
- bool
Reimplemented from Profiler.
Reimplemented in ProfilerSimpleUDP, and ProfilerSimpleDB.
Definition at line 69 of file ProfilerStandard.php.
Return whether this a stub profiler.
- Returns:
- bool
Reimplemented from Profiler.
Definition at line 59 of file ProfilerStandard.php.
Log the data to some store or even the page output.
Reimplemented from Profiler.
Reimplemented in ProfilerSimpleTrace, ProfilerSimpleText, ProfilerSimpleDB, and ProfilerSimpleUDP.
Definition at line 259 of file ProfilerStandard.php.
| ProfilerStandard::profileIn | ( | $ | functionname | ) |
Called by wfProfieIn()
- Parameters:
-
string $functionname
Reimplemented from Profiler.
Reimplemented in ProfilerSimpleTrace.
Definition at line 176 of file ProfilerStandard.php.
| ProfilerStandard::profileOut | ( | $ | functionname | ) |
Called by wfProfieOut()
- Parameters:
-
string $functionname
Reimplemented from Profiler.
Reimplemented in ProfilerSimpleTrace.
Definition at line 198 of file ProfilerStandard.php.
| ProfilerStandard::remapCallTree | ( | array $ | stack | ) | [protected] |
Recursive function the format the current profiling array into a tree.
- Parameters:
-
array $stack Profiling array
- Returns:
- array
Definition at line 300 of file ProfilerStandard.php.
Referenced by getCallTree().
| ProfilerStandard::updateEntry | ( | $ | name, |
| $ | elapsedCpu, | ||
| $ | elapsedReal, | ||
| $ | memChange, | ||
| $ | subcalls = 0, |
||
| $ | period = null |
||
| ) | [protected] |
Update the collation entry for a given method name.
- Parameters:
-
string $name float $elapsedCpu float $elapsedReal int $memChange int $subcalls array | null $period Map of ('start','end','memory','subcalls')
Definition at line 146 of file ProfilerStandard.php.
Member Data Documentation
Map of (function name => aggregate data array) *.
Definition at line 38 of file ProfilerStandard.php.
bool ProfilerStandard::$mCollateDone = false [protected] |
*
Definition at line 39 of file ProfilerStandard.php.
bool ProfilerStandard::$mCollateOnly = false [protected] |
*
Definition at line 40 of file ProfilerStandard.php.
array ProfilerStandard::$mErrorEntry [protected] |
Cache of a standard broken collation entry *.
Definition at line 41 of file ProfilerStandard.php.
ProfilerStandard::$mStack = array() [protected] |
Definition at line 35 of file ProfilerStandard.php.
Queue of open profile calls with start data *.
Definition at line 36 of file ProfilerStandard.php.
The documentation for this class was generated from the following file:
- includes/profiler/ProfilerStandard.php