The mpich/examples/perftest directory contains a sophisticated tool for
measuring latency and bandwidth for mpich on your system.
Simply change to the
mpich/examples/perftest directory and do
    make
    mpirun -np 2 mpptest -gnuplot > out.gpl
The file out.gpl will then contain the necessary gnuplot
commands. The
file mppout.gpl will contain the data. To view the data with
gnuplot,
use:
gnuplot out.gplor use
load 'out.gpl'from within gnuplot. Depending on your environment and version of gnuplot, you may need to start gnuplot first and issue the command set terminal x11 before executing load 'out.gpl'. You can use
    gnuplot
    set term postscript eps
    set output "foo.eps"
    load 'out.gpl'
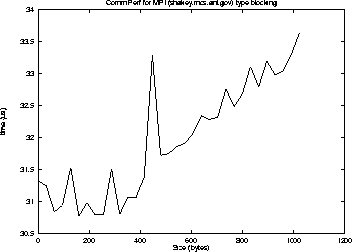
to create an Encapsulated Postscript graph such as the one in
Figure 1
.

The programs mpptest and goptest have a wide variety of capabilities; the option -help will list them. For example, mpptest can automatically pick message lengths to discover any sudden changes in behavior and can investigate the ability to overlap communication with computation. These programs are written using MPI, and may be used with any MPI implementation, not just mpich. (See the configure file in the examples/perftest directory.) More information is available at http://www.mcs.anl.gov/mpi/mpptest.
Benchmarking can be very tricky. Some common benchmarking errors are discussed at http://www.mcs.anl.gov/mpi/mpptest/hownot.html. The paper [13] discusses these issues at more length.