
The mpich
sdk
examples
nt

examples
nt
mpptest
directory and do
mpirun -np 2 mpptest -gnuplot > out.gplThe file out.gpl will then contain the necessary gnuplot commands. The file mppout.gpl will contain the data. To view the data with gnuplot, use:
gnuplot out.gplor use
load 'out.gpl'from within gnuplot. You can use
    gnuplot
    set term postscript eps
    set output "foo.eps"
    load 'out.gpl'
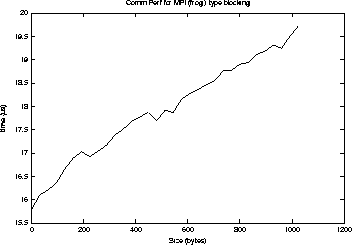
to create an Encapsulated Postscript graph such as the one in
Figure 1
.
The program mpptest has a wide variety of capabilities; the option -help will list them. For example, mpptest can automatically pick message lengths to discover any sudden changes in behavior and can investigate the ability to overlap communication with computation. More information is available at http://www.mcs.anl.gov/mpi/mpptest.
gnuplot can be found here: ftp://ftp.dartmouth.edu/pub/gnuplot
Benchmarking can be very tricky. Some common benchmarking errors are discussed at http://www.mcs.anl.gov/mpi/mpptest/hownot.html. The paper [10] discusses these issues at more length.