Introduction
This paper describes and provides performance data for some of the key system characteristics of the 1060 NetKernel
URI Request Scheduling Microkernel.
Tests are presented which demonstrate the characteristics of:
Tests data are presented which show the effects on throughput and response time as a single system parameter is varied:
Configuration Information
The test-system configuration was: 1060 NetKernel Standard Edition v1.1.1
with "out-of-the-box" configuration except where specifically detailed,
running on Sun JDK1.4.1 on Redhat Linux 9. The hardware configuration
was a dual Intel Xeon 2.0Ghz machine with 1.5GB RAM. Throughput and
response times were captured using Apache JMeter 1.9.1 running on a
remote machine connected by a 100Mbit Ethernet connection.
The actual test process executed is described with each test. The test application processes were not
optimized for absolute performance - the whole test is designed to provide an indication of relative
performance with respect to changes to the general properties of the system.
Throttle
NetKernel has a request throttle which is designed to manage the
incoming transport request profile. It works by
acting as a gatekeeper for incoming requests from transports to the
kernel. It can either allow a request to proceed, queue a request for
an indefinite duration or reject the request. It is configured by two
parameters:
- Maximum number of concurrent requests - the maximum number of concurrent requests
to admit to the kernel. When the number of requests exceed this all further
requests are queued until existing kernel requests complete.
- Maximum number of queued requests - the maximum size of the request queue. If the maximum queue size is
reached then new requests will start to be rejected.
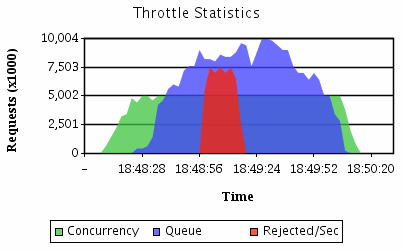
The following graph shows how the throttle reacts to a sudden surge of activity
where the requested workload exceeds capacity for a period of time. In this test the throttle allows 5 concurrent
requests and has a queue size of 10 requests - this is a deliberately small queue in order to demonstrate the
rejection regime, a production system can have as large a queue as required to avoid request rejection.

The graph shows an initial period when all requests are handled
immediately. As demand continues to rise, the maximum number of concurrent kernel requests is reached, new requests cannot be issued to the kernel so
requests start to become queued. As even more requests are added the queue size grows until it reaches it's maximum size, new requests
are now rejected instantly. When using the HTTP transport, rejected requests are
given a HTTP 502 "service temporarily overloaded" response code. As the surge of
activity decays the queued requests are processed and the system returns to its
quiescent state.
This profile demonstrates the overload characteristics of NetKernel. The maximum concurrent kernel requests and throttle queue size can be
set according to your systems expected load. The throttle provides a guaranteed safe upper bound to the system - whilst an overloaded NetKernel
will eventually reject requests it will do so gracefully and the kernel itself will never suffer overload and cannot fall over.
You can examine the real-time throttle status of your system
as part of the NetKernel Control Panel.
Throughput under Varied Loading
JMeter was used to feed HTTP requests to NetKernel running on the test
machine. A fixed URL was used which mapped to a test harness DPML script.
The number of concurrent threads feeding requests was varied between 1 and
32 and the throughput and response times captured. All tests were
performed with a 64MB JVM heap size. The NetKernel
configuration was “out-of-the-box”. Three different test harness/scenarios were used:
- A long CPU bound computation was wrapped inside an accessor which
was called once from inside a controlling DPML script for each request.
The scenario was designed to be as simple as possible - minimal kernel scheduler load, minimal network traffic. This
is an ideal scenario to show the ideal response curve.
- A short CPU bound computations was wrapped inside an accessor which
was called 8 times from inside a controlling DPML script for each request.
The test was design to increase network, scheduling and garbage collection
overhead highlighting non-linearities.
- A controlling DPML script choose at random one system document (from
the NetKernel Standard Edition documentation) from a random set of 50.
The test was designed to increase the application working set to a more
realistic size and leverage the cache to serve content rather than
recomputation. The test harness adds an additional small amount of processing
for each request.
Each graph shows a profile very close to the theoretical ideal. They show that our dual processor test system is
optimally utilized: with two concurrent requests throughput doubles but response time remains the same. For more than two concurrent
requests throughput remains constant and response times degrade linearly.
NetKernel achieves this close to ideal load scalability because the throttle
always allows the kernel to work at it's optimum performance.
Scenario 3 shows some slight non-linear behaviour - this is an artifact of the large size of the response data loading the TCP/IP network between the
test server and the test client. The throttle architecture means that NetKernel will always present a constant throughput.
Microkernel Architecture
NetKernels Microkernel architecture ensures that it can operate in
very small memory footprints. It has been carefully performance tuned to reduce memory usage both within the
kernel and in low level modules.
Throughput with Limited Heap Memory
JMeter was used to feed 4 concurrent HTTP requests to NetKernel running
on the test machine. A fixed URI was used which mapped to a test harness
DPML script. The available Java Virtual Machine heap memory was reduced
from 256MB down 12MB and the Throughput and Response times captured. The
NetKernel configuration was “out-of-the-box”. Two different test harnesses
were used:
- A controlling DPML script generated at random one system document (from
the NetKernel Standard Edition documentation) from a random set of 200.
The test was designed to have an application working set of a
realistic size and leverage the cache to serve content when memory is available.
- A short CPU bound computation was wrapped inside an accessor
which was called 8 times from inside a controlling DPML script for each
request. Only a small amount of object creation was necessary to process
each request.
It can be seen that for pure processing operations that have minimal object
creation, the kernel can operate in extremely small heap sizes. When
processing is complex, a larger working set of heap is required but excess
heap is utilized to cache results. The test shows that at small memory size
the JVM garbage collector adversly effects the system. As heap size is increased, throughput increases proportionality
until the heap is large enough to support a cache where all cacheable results are cached and there is a plentiful supply of heap
for transient object creation. It is worth noting that in this
scenario approximately 90% throughput efficiency is achieved in 64MB of
heap.
This test demonstrates that NetKernel applications can be run in extremely small
JVMs - whilst this comes at a performance cost it shows that the system offers a broad
level of scalability. In tests we have successfully run NetKernel applications in
under 6MB.
Caching
NetKernel can be configured to use varying levels of resource cache. Caches exhibit the following characteristics:
- Optional the system will function without any cache at all.
- Plugable different caches with different implementations or
configurations can be employed on different applications within the same
NetKernel instance.
- Transparent application code doesn't have to specify what should
and shouldn't be cached. However explicit tuning can be added to prevent, or
alternatively,encourage specific caching of resources.
- Dependency Based all shipped accessors and transreptors build
dependency information such as expiry and cost into the meta data of
derived resources. The dependency metadata is used by caches to optimsize resource caching and to
eliminate dependent resources from cache when a dependant expires.
In-Memory Level 1 Cache
JMeter was used to feed 8 concurrent HTTP requests to NetKernel running
on the test machine. A fixed URI was used which mapped to a test harness
DPML script. The script generated at random one system document (from
the NetKernel Standard Edition documentation) from a random set of 50.
The test was performed with a 64MB JVM. The NetKernel
configuration was “out-of-the-box” except that the Level 1 maximum cache size was varied
from 0 to 400 resources, Level 2 cache was disabled.
It can be seen that in this scenario the throughput increases linearly
with increasing L1 cache size until all valuable resources are
cached at which point increases in cache size only present
a small overhead. Cached resources might include parsed XML documents,
XSLT stylesheets, DPML scripts, intermediate results and final results.
Baseline memory usage, the lowest level to which the garbage collector
can reduce heap size, increases as cache size increases showing that
resources are being held in heap memory.
This test shows an idealised scenario where all results are cacheable.
Careful partitioning of applications can result in large levels of cacheability,
even for applications with dynamic content.
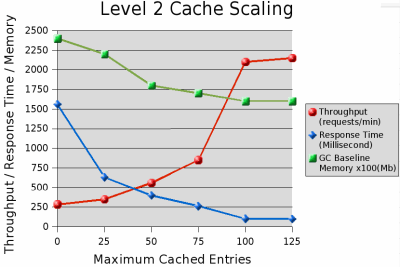
Disk Level 2 Cache
JMeter was used to feed 8 concurrent HTTP requests to NetKernel running
on the test machine. A fixed URI was used which mapped to a test harness
DPML script. The script generated at random one system document (from
the NetKernel Standard Edition documentation) from a random set of 100.
The test was performed with a 64MB JVM. The NetKernel
configuration was “out-of-the-box” except that: Level 1 maximum cache size was
fixed at 25 resources, Level 2 disk cache maximum size was varied
from 0 to 125 resources. With such a small Level 1 cache only critical
and frequently used parts of the application working set can be kept in
the heap. The level 2 cache will be used to store high value results.


It can be seen that in this scenario the throughput increases dramatically
until all valuable results (ie all 100 documents) are stored in the Level 2 cache. At this
point further increases in size have no effect. Baseline memory usage falls monotonically
with increases in L2 cache - this is because a reduced application working set of resources is needed as more results
are found in cached rather than recomputed.
Summary
These results present orthogonal profiles through the NetKernel configuration space. All results are relative but give a picture of the
performance characteristics you can expect from NetKernel. The default system configuration provides a reasonable compromise system "out-of-the-box" - you
may want to experiment with different throttle, JVM size and L1, L2 cache
sizes to optimize throughput for your given application set.