PuppetDB 1 » Maintaining and Tuning
PuppetDB requires a relatively small amount of maintenance and tuning. You should become familiar with the following occasional tasks:
Monitor the Performance Dashboard
Once you have PuppetDB running, visit the following URL, substituting in the name and port of your PuppetDB server:
http://puppetdb.example.com:8080/dashboard/index.html
Note: You may need to edit PuppetDB’s HTTP configuration first, changing the
hostsetting to the server’s externally-accessible hostname. When you do this, you should also configure your firewall to control access to PuppetDB’s cleartext HTTP port.
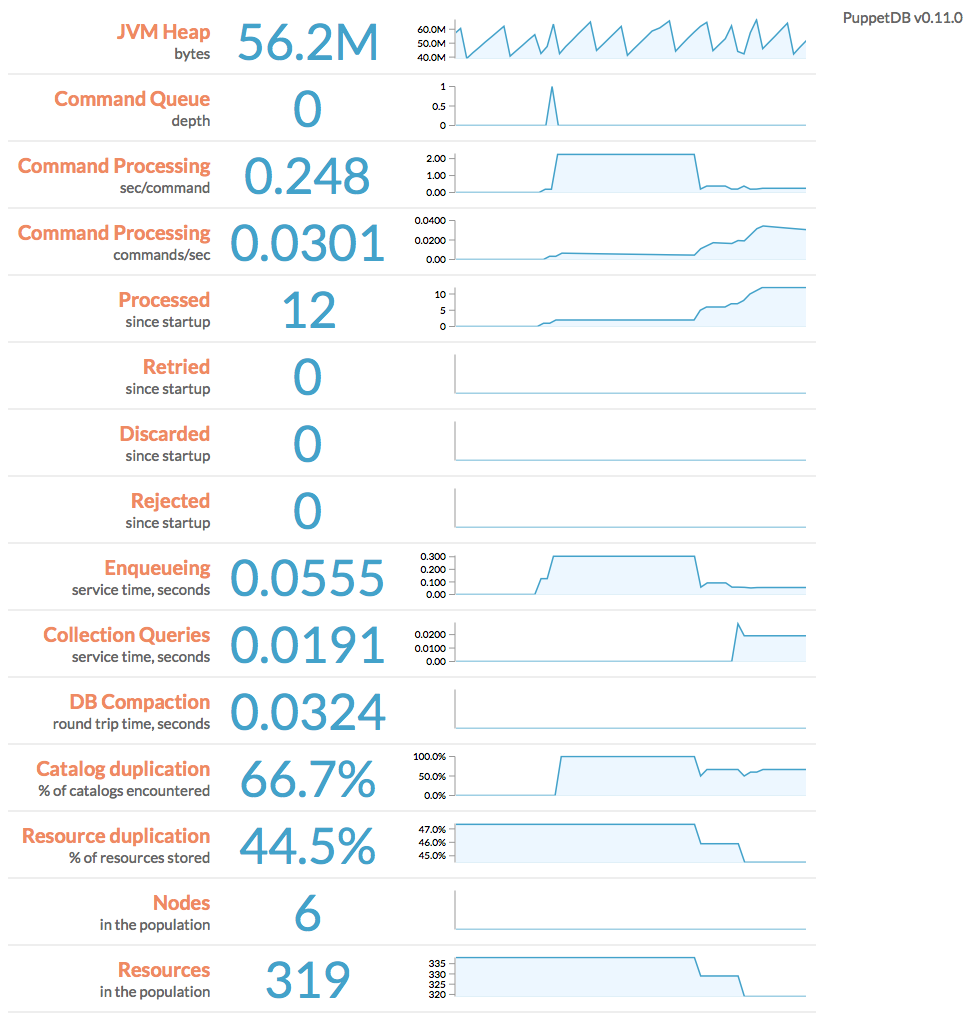
PuppetDB uses this page to display a web-based dashboard with performance information and metrics, including its memory use, queue depth, command processing metrics, duplication rate, and query stats. It displays min/max/median of each metric over a configurable duration, as well as an animated SVG “sparkline” (a simple line chart that shows general variation). It also displays the current version of PuppetDB and checks for updates, showing a link to the latest package if your deployment is out of date.
You can use the following URL parameters to change the attributes of the dashboard:
width= width of each sparkline, in pixelsheight= height of each sparkline, in pixelsnHistorical= how many historical data points to use in each sparklinepollingInterval= how often to poll PuppetDB for updates, in milliseconds
E.g.: http://puppetdb.example.com:8080/dashboard/index.html?height=240&pollingInterval=1000
Deactivate Decommissioned Nodes
When you remove a node from your Puppet deployment, it should be marked as deactivated in PuppetDB. This will ensure that any resources exported by that node will stop appearing in the catalogs served to the remaining agent nodes.
- PuppetDB can automatically deactivate nodes that haven’t checked in recently. To enable this, set the
node-ttl-dayssetting. -
If you prefer to manually deactivate nodes, use the following command on your puppet master:
$ sudo puppet node deactivate <node> [<node> ...] - Any deactivated node will be reactivated if PuppetDB receives new catalogs or facts for it.
Although deactivated nodes will be excluded from storeconfigs queries, their data is still preserved.
Note: Deactivating a node does not remove (e.g.
ensure => absent) exported resources from other systems; it only stops managing those resources. If you want to actively destroy resources from deactivated nodes, you will probably need to purge that resource type using theresourcesmetatype. Note that some types cannot be purged (e.g. ssh authorized keys), and several others usually should not be purged (e.g. users).
View the Log
PuppetDB’s log file lives at /var/log/pe-puppetdb/pe-puppetdb.log (for PE users) or /var/log/puppetdb/puppetdb.log (for open source users). Check the log when you need to confirm that PuppetDB is working correctly or to troubleshoot visible malfunctions. If you have changed the logging settings, examine the log4j.properties file to find the log.
The PuppetDB packages install a logrotate job in /etc/logrotate.d/puppetdb, which will keep the log from becoming too large.
Tune the Max Heap Size
Although we provide rule-of-thumb memory recommendations, PuppetDB’s RAM usage depends on several factors, so memory needs will vary depending on the number of nodes, frequency of Puppet runs, and amount of managed resources. 1000 nodes that check in once a day will require much less memory than if they check in every 30 minutes.
So the best way to manage PuppetDB’s max heap size is to estimate a ballpark figure, then monitor the performance dashboard and increase the heap size if the “JVM Heap” metric keeps approaching the maximum. You may need to revisit your memory needs whenever your site grows substantially.
The good news is that memory starvation is actually not very destructive. It will cause OutOfMemoryError exceptions to appear in the log, but you can restart PuppetDB with a larger memory allocation and it’ll pick up where it left off — any requests successfully queued up in PuppetDB will get processed.
Tune the Number of Threads
When viewing the performance dashboard, note the MQ depth. If it is rising and you have CPU cores to spare, increasing the number of threads may help process the backlog faster.
If you are saturating your CPU, we recommend lowering the number of threads. This prevents other PuppetDB subsystems (such as the web server, or the MQ itself) from being starved of resources and can actually increase throughput.
Redo SSL Setup After Changing Certificates
If you’ve recently changed the certificates in use by the PuppetDB server, you’ll also need to update the SSL configuration for PuppetDB itself.
If you’ve installed PuppetDB from Puppet Labs packages, you can simply re-run the puppetdb-ssl-setup script. Otherwise, you’ll need to again perform all the SSL configuration steps outlined in the installation instructions.