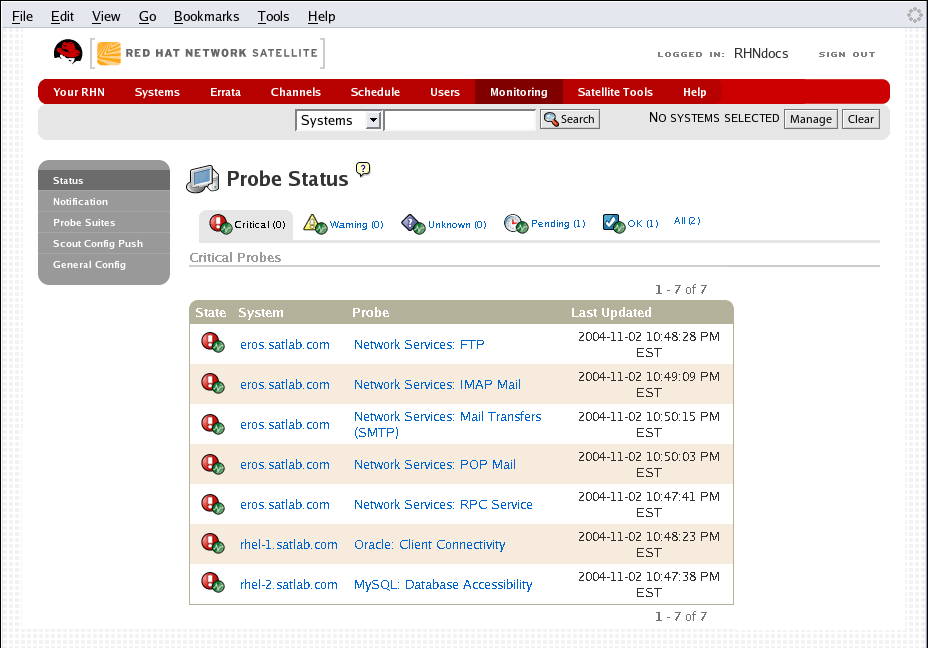
As shown in Figure 6.21, “Probe Status”, the Probe Status page is shown by default when you click Monitoring in the top navigation bar.
The Probe Status page displays the summary count of probes in the various states and provides a simple interface to find problematic probes quickly. Please note that the probe totals in the tabs at the top of the page may not match the numbers of probes displayed in the tables below. The counts at the top include probes for all systems in your organization, while the tables display probes on only those systems to which you have access through the System Group Administrator role. Also, the probe counts displayed here may be out of sync by as much as one minute.
The following list describes each state and identifies the icons associated with them:
![]() — Critical - The probe has crossed a CRITICAL threshold.
— Critical - The probe has crossed a CRITICAL threshold.
![]() — Warning - The probe has crossed a WARNING threshold.
— Warning - The probe has crossed a WARNING threshold.
![]() — Unknown - The probe is not able to accurately report metric or state data.
— Unknown - The probe is not able to accurately report metric or state data.
![]() — Pending - The probe has been scheduled but has not yet run or is unable to run.
— Pending - The probe has been scheduled but has not yet run or is unable to run.
![]() — OK - The probe is running successfully.
— OK - The probe is running successfully.
The Probe Status page contains tabs for each of the possible states, as well as one that lists all probes. Each table contains columns indicating probe state, the monitored system, the probes used, and the date and time the status was last updated.
In these tables, clicking the name of the system takes you to the Probes tab of the System Details page. Clicking the name of the probe takes you to its Current State page. From there, you may edit the probe, delete it, and generate reports based upon its results.
Monitoring data and probe status information that was previously availble only through the web interface of the Satellite can now be exported as a CSV file. Click on the Download CSV links throughout the Monitoring pages to download CSV files of relevent information. The exported data may include, but is not limited to:
Probe status
All probes in a given state (OK, WARN, UNKNOWN, CRITICAL, PENDING)
A Probe Event history