Chapter 5. Visual Explain
How quickly your database responds to queries depends in part on the design of the database. You can learn how the structure of the database affects performance by using the PostgreSQL EXPLAIN and EXPLAIN ANALYZE commands to show the query plan for an optimizable query. Without Visual Explain, the output from these commands is a plain-text tree, which can be difficult to interpret for complex queries. Visual Explain's graphical display of these query plans is much easier to interpret.
EXPLAIN measures the performance cost of queries in units of disk-page fetches, which include a guess of the CPU effort converted into disk-page units as well. EXPLAIN gives estimates of:
The start-up cost (the time expended before an output scan can start). For example, the time to do the sorting in a SORT node.
The total cost, if all tuples are retrieved (which they may not be; for example, a query with a LIMIT will stop short of the total cost).
The number of rows output by this plan node (again, without regard for any LIMIT clause).
The average width (in bytes) of rows output by this plan node.
EXPLAIN does not estimate the time spent transmitting result tuples to the frontend as this is a fixed cost that depends on the size of the result set.
 | To Learn More About EXPLAIN |
|---|---|
The SQL commands that are optimizable and can be analyzed by EXPLAIN are:
For more information on the EXPLAIN and EXPLAIN ANALYZE commands, refer to the Red Hat Database SQL Guide and Reference. For more information on performance tuning, see Performance Tips in the Red Hat Database Administrator and User's Guide. |
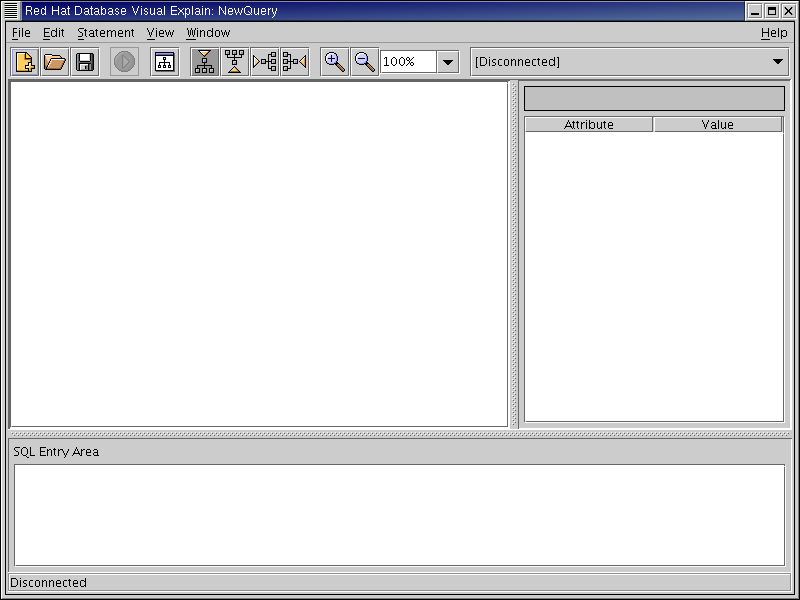
Starting Visual Explain
To start Visual Explain, you can either:
Run Visual Explain from a command line:
$ rhdb-explain &
Under Gnome, click on the Gnome foot, then select Programs -> Red Hat Database -> Red Hat Database Visual Explain.
