

Edition 0
1801 Varsity Drive
Raleigh, NC 27606-2072 USA
Phone: +1 919 754 3700
Phone: 888 733 4281
Fax: +1 919 754 3701
Mono-spaced Bold
To see the contents of the filemy_next_bestselling_novelin your current working directory, enter thecat my_next_bestselling_novelcommand at the shell prompt and press Enter to execute the command.
Press Enter to execute the command.Press Ctrl+Alt+F2 to switch to the first virtual terminal. Press Ctrl+Alt+F1 to return to your X-Windows session.
mono-spaced bold. For example:
File-related classes includefilesystemfor file systems,filefor files, anddirfor directories. Each class has its own associated set of permissions.
Choose → → from the main menu bar to launch Mouse Preferences. In the Buttons tab, click the Left-handed mouse check box and click to switch the primary mouse button from the left to the right (making the mouse suitable for use in the left hand).To insert a special character into a gedit file, choose → → from the main menu bar. Next, choose → from the Character Map menu bar, type the name of the character in the Search field and click . The character you sought will be highlighted in the Character Table. Double-click this highlighted character to place it in the Text to copy field and then click the button. Now switch back to your document and choose → from the gedit menu bar.
Mono-spaced Bold ItalicProportional Bold Italic
To connect to a remote machine using ssh, typesshat a shell prompt. If the remote machine isusername@domain.nameexample.comand your username on that machine is john, typessh [email protected].Themount -o remountcommand remounts the named file system. For example, to remount thefile-system/homefile system, the command ismount -o remount /home.To see the version of a currently installed package, use therpm -qcommand. It will return a result as follows:package.package-version-release
Publican is a DocBook publishing system.
mono-spaced roman and presented thus:
books        Desktop   documentation  drafts  mss    photos   stuff  svn
books_tests  Desktop1  downloads      images  notes  scripts  svgs
mono-spaced roman but add syntax highlighting as follows:
package org.jboss.book.jca.ex1;

import javax.naming.InitialContext;

public class ExClient
{
   public static void main(String args[])
       throws Exception
   {
      InitialContext iniCtx = new InitialContext();
      Object         ref    = iniCtx.lookup("EchoBean");
      EchoHome       home   = (EchoHome) ref;
      Echo           echo   = home.create();

      System.out.println("Created Echo");

      System.out.println("Echo.echo('Hello') = " + echo.echo("Hello"));
   }
}
gcc, gdb, etc) and Eclipse offer two distinct approaches to programming. Most traditional Linux tools are far more flexible, subtle, and (in aggregate) more powerful than their Eclipse-based counterparts. These traditional Linux tools, on the other hand, are more difficult to master, and offer more capabilities than are required by most programmers or projects. Eclipse, by contrast, sacrifices some of these benefits in favor of an integrated environment, which in turn is suitable for users who prefer their tools accessible in a single, graphical interface.
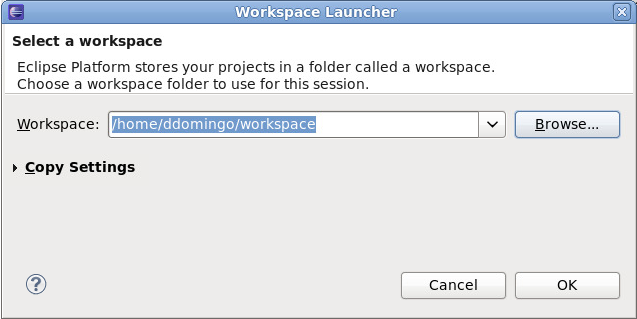
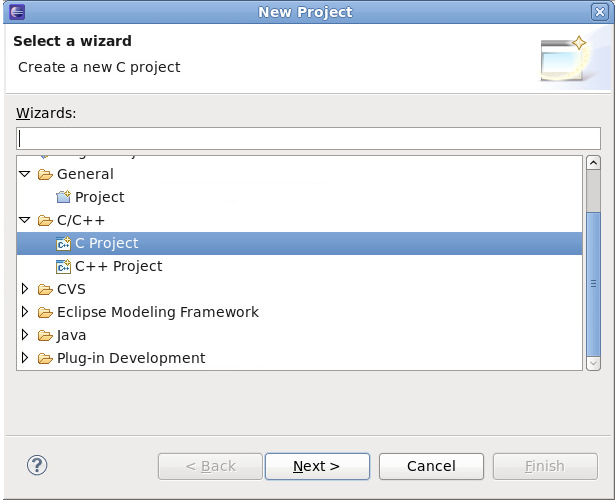
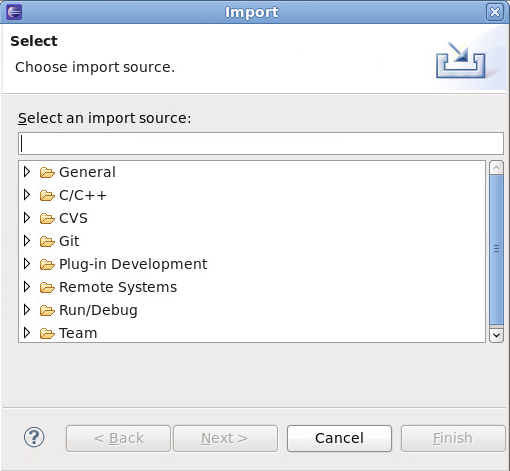
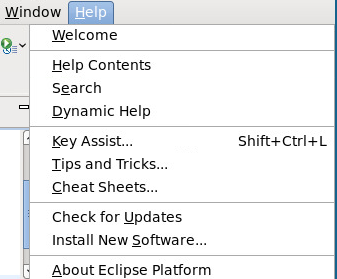
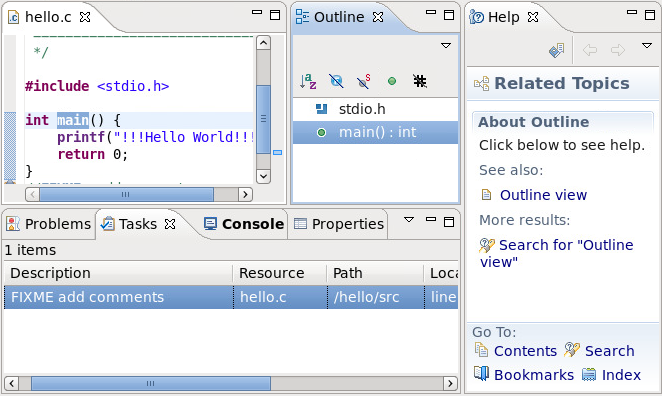
CDT) and Java (JDT). These toolkits provide a set of integrated tools specific to their respective languages. Both toolkits supply Eclipse GUI interfaces with the required tools for editing, building, running, and debugging source code.
CDT and JDT also provide multiple editors for a variety of file types used in a project. For example, the CDT supplies different editors specific for C/C++ header files and source files, along with a Makefile editor.
CDT source file editor, for example, provides error parsing in the context of a single file, but some errors may only be visible when a complete project is built. Other common features among toolkit-supplied editors are colorization, code folding, and automatic indentation. In some cases, other plug-ins provide advanced editor features such as automatic code completion, hover help, and contextual search; a good example of such a plug-in is libhover, which adds these extended features to C/C++ editors (refer to Section 2.2.2, “libhover Plug-in” for more information).
Autotools plug-in, for example, allows you to add portability to a C/C++ project, allowing other developers to build the project in a wide variety of environments (for more information, refer to Section 4.3, “Autotools”).
CDT and JDT. For more information on either toolkit, refer to the Java Development User Guide or C/C++ Development User Guide in the Eclipse .
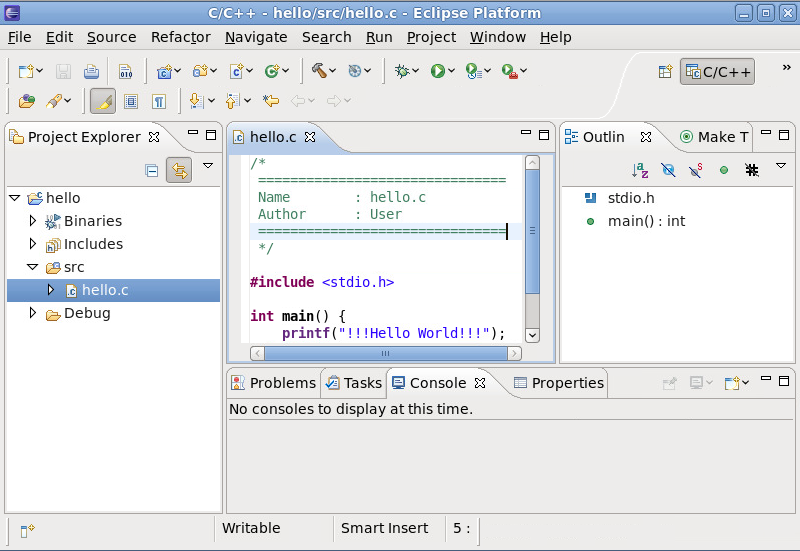
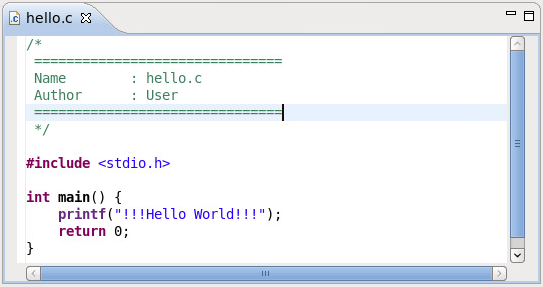
.c) for most types of source files. To configure the settings for the Editor, navigate to > > > .
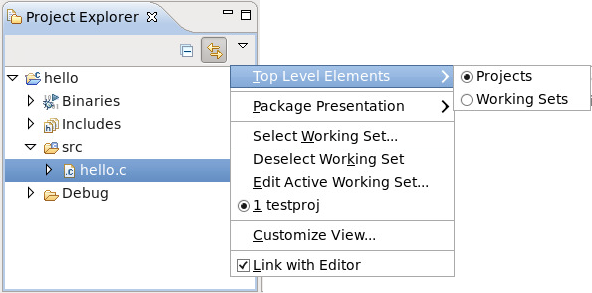
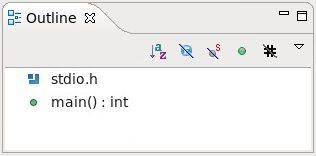
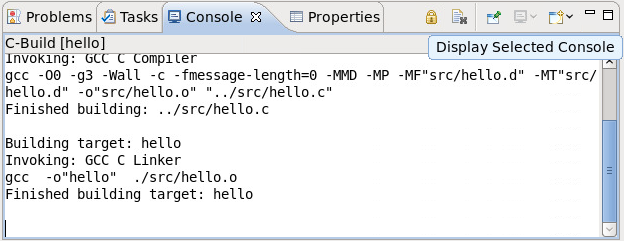

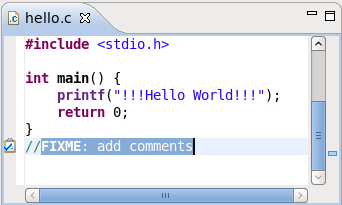
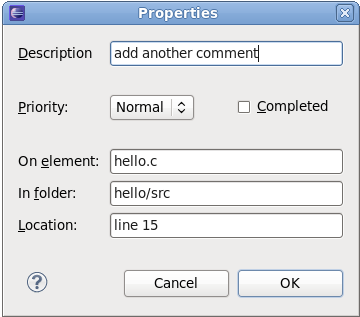
//FIXME or //TODO tags. Tracked comments—i.e. task tags—are different for source files written in other languages. To add or configure task tags, navigate to > and use the keyword task tags to display the task tag configuration menus for specific editors/languages.
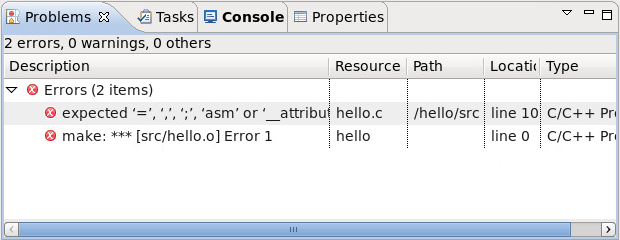
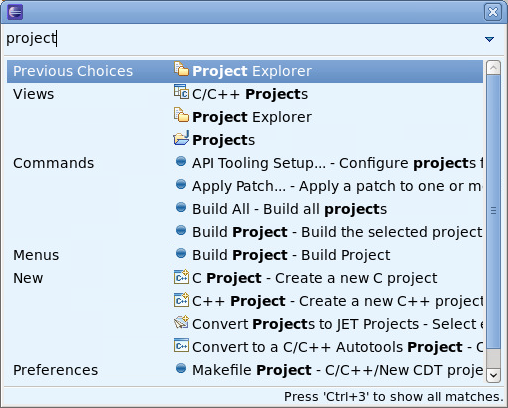
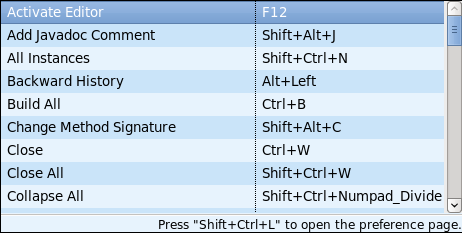
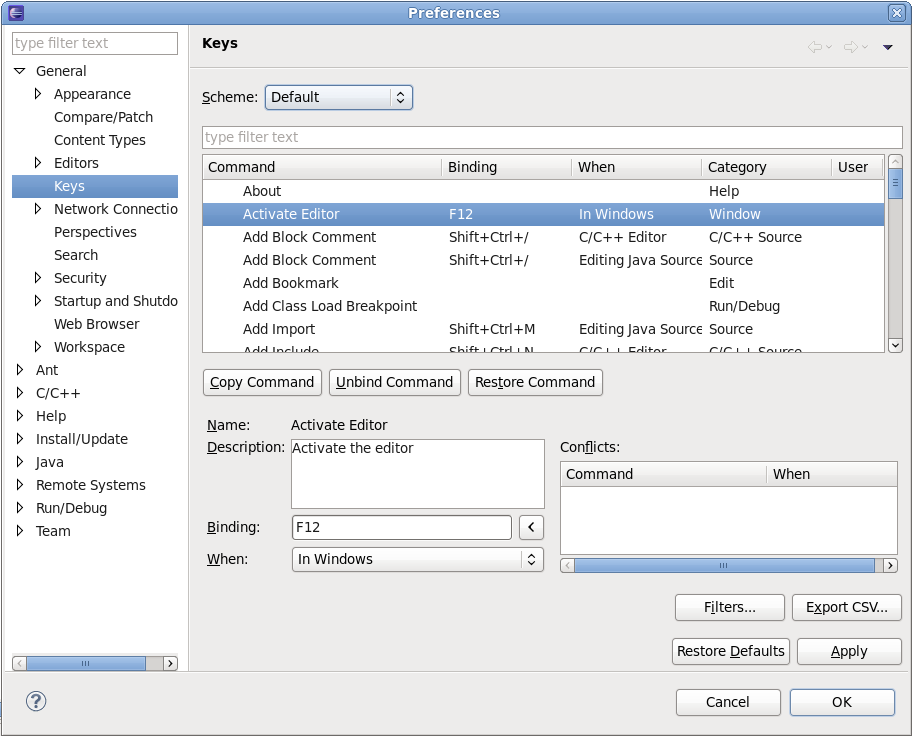
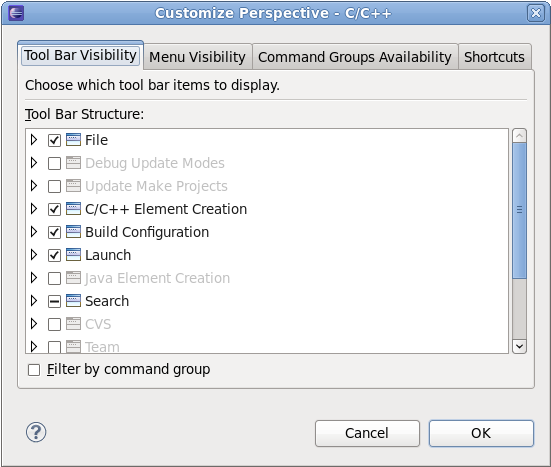

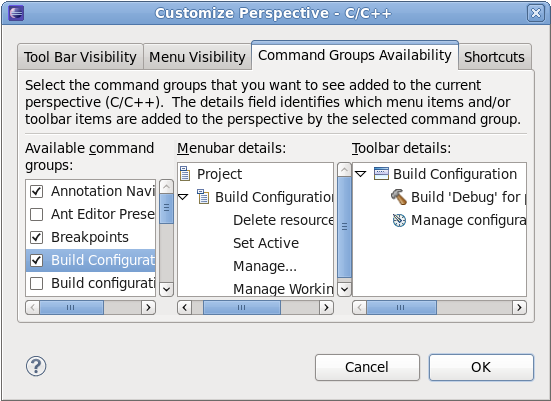
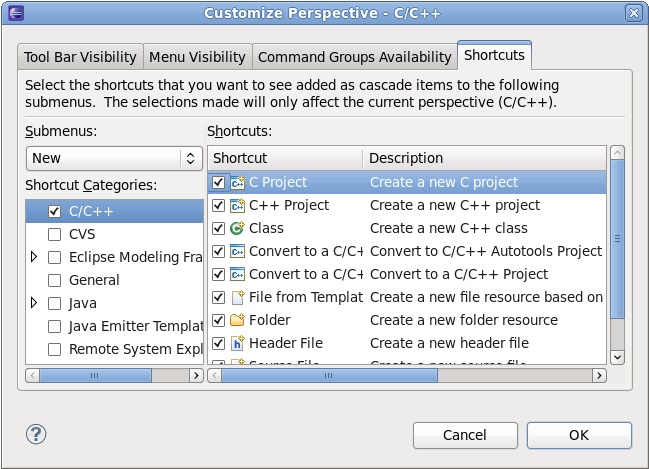
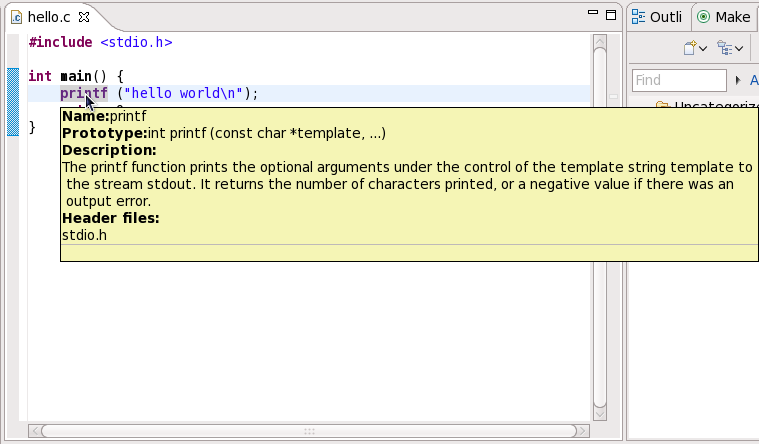
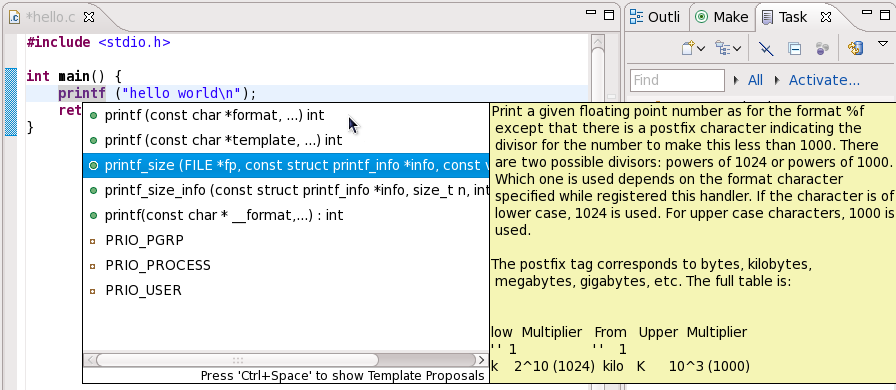
libhover plug-in for Eclipse provides plug-and-play hover help support for the GNU C Library and GNU C++ Standard Library. This allows developers to refer to existing documentation on glibc and libstdc++ libraries within the Eclipse IDE in a more seamless and convenient manner via hover help and code completion.
libhover needs to index the file using the CDT indexer. Indexing parses the given file in context of a build; the build context determines where header files come from and how types, macros, and similar items are resolved. To be able to index a C++ source file, libhover usually requires you to perform an actual build first, although in some cases it may already know where the header files are located.
libhover plug-in may need indexing for C++ sources because a C++ member function name is not enough information to look up its documentation. For C++, the class name and parameter signature of the function is also required to determine exactly which member is being referenced. This is because C++ allows different classes to have members of the same name, and even within a class, members may have the same name but with different method signatures.
include files; libhover can only do this via indexing.
libhover does not need to index C source files in order to provide hover help or code completion. Simply choose an appropriate C header file to be included for a selection.
libhover libraries is enabled by default, and it can be disabled per project. To disable or enable hover help for a particular project, right-click the project name and click . On the menu that appears, navigate to > . Check or uncheck a library in the section to enable or disable hover help for that particular library.
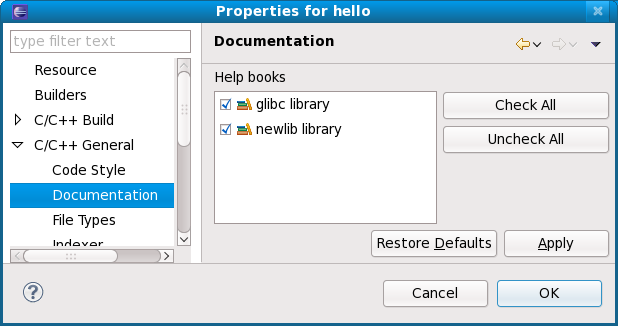
libhover libraries overlap in functionality. For example, the newlib library (whose libhover library plug-in is supported in Red Hat Enterprise Linux 6) contains functions whose names overlap with those in the GNU C library (provided by default); having libhover plugins for both newlib and glibc installed would mean having to disable one.
libhover libraries libraries are enabled and there exists a functional overlap between libraries, the Help content for the function from the first listed library in the section will appear in hover help (i.e. in Figure 2.18, “Enabling/Disabling Hover Help”, glibc). For code completion, libhover will offer all possible alternatives from all enabled libhover libraries.
libhover will display library documentation on the selected C function or C++ member function.
| Package Name | 6 | 5 | 4 |
|---|---|---|---|
| glibc | 2.12 | 2.5 | 2.3 |
| libstdc++ | 4.4 | 4.1 | 3.4 |
| boost | 1.41 | 1.33 | 1.32 |
| java | 1.5 (IBM), 1.6 (IBM, OpenJDK) | 1.4, 1.5, and 1.6 | 1.4 |
| python | 2.6 | 2.4 | 2.3 |
| php | 5.3 | 5.1 | 4.3 |
| ruby | 1.8 | 1.8 | 1.8 |
| httpd | 2.2 | 2.2 | 2.0 |
| postgresql | 8.4 | 8.1 | 7.4 |
| mysql | 5.1 | 5.0 | 4.1 |
| nss | 3.12 | 3.12 | 3.12 |
| openssl | 1.0.0 | 0.9.8e | 0.9.7a |
| libX11 | 1.3 | 1.0 | |
| firefox | 3.6 | 3.6 | 3.6 |
| kdebase | 4.3 | 3.5 | 3.3 |
| gtk2 | 2.18 | 2.10 | 2.04 |
glibc package contains the GNU C Library. This defines all functions specified by the ISO C standard, POSIX specific features, some Unix derivatives, and GNU-specific extensions. The most important set of shared libraries in the GNU C Library are the standard C and math libraries.
stdio.h header file defines I/O-specific facilities, while math.h defines functions for computing mathematical operations.
preadv
preadv64
pwritev
pwritev64
malloc_info
mkostemp
mkostemp64
epoll_pwait
sched_getcpu
accept4
fallocate
fallocate64
inotify_init1
dup3
epoll_create1
pipe2
signalfd
eventfd
eventfd_read
eventfd_write
asprintf
dprintf
obstack_printf
vasprintf
vdprintf
obstack_vprintf
fread
fread_unlocked
open*
mq_open
/usr/share/doc/glibc-version/NEWS . All changes as of version 2.6 apply to the GNU C Library in Red Hat Enterprise Linux 6. Some of these changes have also been backported to Red Hat Enterprise Linux 5 versions of glibc.
libstdc++ package contains the GNU C++ Standard Library, which is an ongoing project to implement the ISO 14882 Standard C++ library.
libstdc++ package will provide just enough to satisfy link dependencies (i.e. only shared library files). To make full use of all available libraries and header files for C++ development, you must install libstdc++-devel as well. The libstdc++-devel package also contains a GNU-specific implementation of the Standard Template Library (STL).
libstdc++. However, combatability libraries compat-libstdc++-296 for Red Hat Enterprise Linux 2.1 and compat-libstdc++-33 for Red Hat Enterprise Linux 3 are provided for support.
<tr1/array>
<tr1/complex>
<tr1/memory>
<tr1/functional>
<tr1/random>
<tr1/regex>
<tr1/tuple>
<tr1/type_traits>
<tr1/unordered_map>
<tr1/unordered_set>
<tr1/utility>
<tr1/cmath>
<array>
<chrono>
<condition_variable>
<forward_list>
<functional>
<initalizer_list>
<mutex>
<random,
<ratio>
<regex>
<system_error>
<thread>
<tuple>
<type_traits
<unordered_map>
<unordered_set>
-fvisibility command.
__gnu_cxx::typelist
__gnu_cxx::throw_allocator
libstdc++ in Red Hat Enterprise Linux 6, refer to the C++ Runtime Library section of the following documents:
man pages for library components, install the libstdc++-docs package. This will provide man page information for nearly all resources provided by the library; for example, to view information about the vector container, use its fully-qualified component name:
man std::vector
std::vector(3)                                                  std::vector(3)

NAME
       std::vector -

       A standard container which offers fixed time access to individual
       elements in any order.

SYNOPSIS
       Inherits std::_Vector_base< _Tp, _Alloc >.

   Public Types
       typedef _Alloc allocator_type
       typedef __gnu_cxx::__normal_iterator< const_pointer, vector >
           const_iterator
       typedef _Tp_alloc_type::const_pointer const_pointer
       typedef _Tp_alloc_type::const_reference const_reference
       typedef std::reverse_iterator< const_iterator >
libstdc++-docs package also provides manuals and reference information in HTML form at the following directory:
file:///usr/share/doc/libstdc++-docs-version/html/spine.html
boost package contains a large number of free peer-reviewed portable C++ source libraries. These libraries are suitable for tasks such as portable file-systems and time/date abstraction, serialization, unit testing, thread creation and multi-process synchronization, parsing, graphing, regular expression manipulation, and many others.
boost package will provide just enough to satisfy link dependencies (i.e. only shared library files). To make full use of all available libraries and header files for C++ development, you must install boost-devel as well.
boost package is actually a meta-package, containing many library sub-packages. These sub-packages can also be installed in an a la carte fashion to provide finer inter-package dependency tracking. The meta-package inclues all of the following sub-packages:
boost-date-time
boost-filesystem
boost-graph
boost-iostreams
boost-math
boost-program-options
boost-python
boost-regex
boost-serialization
boost-signals
boost-system
boost-test
boost-thread
boost-wave
boost-openmpi
boost-openmpi-devel
boost-graph-openmpi
boost-openmpi-python
boost-mpich2
boost-mpich2-devel
boost-graph-mpich2
boost-mpich2-python
boost-static package will install the necessary static libraries. Both thread-enabled and single-threaded libraries are provided.
boost package have changed. As noted above, the monolithic boost package has been augmented by smaller, more discrete sub-packages. This allows for more control of dependencies by users, and for smaller binary packages when packaging a custom application that uses Boost.
mt suffix, as per the usual Boost convention.
boost-doc package provides manuals and reference information in HTML form located in the following directory:
file:///usr/share/doc/boost-doc-version/index.html
qt package provides the Qt (pronounced "cute") cross-platform application development framework used in the development of GUI programs. Aside from being a popular "widget toolkit", Qt is also used for developing non-GUI programs such as console tools and servers. Qt was used in the development of notable projects such as Google Earth, KDE, Opera, OPIE, VoxOx, Skype, VLC media player and VirtualBox. It is produced by Nokia's Qt Development Frameworks division, which came into being after Nokia's acquisition of the Norwegian company Trolltech, the original producer of Qt, on June 17, 2008.
qt-doc package provides HTML manuals and references located in /usr/share/doc/qt4/html/. This package also provides the Qt Reference Documentation, which is an excellent starting point for development within the Qt framework.
qt-demos and qt-examples. To get an overview of the capabilities of the Qt framework, refer to /usr/bin/qtdemo-qt4 (provided by qt-demos).
kdelibs-devel package provides the KDE libraries, which build on Qt to provide a framework for making application development easier. The KDE development framework also helps provide consistency accross the KDE desktop environment.
kspell2 in KDE4.
python package adds support for the Python programming language. This package provides the object and cached bytecode files needed to enable runtime support for basic Python programs. It also contains the python interpreter and the pydoc documentation tool. The python-devel package contains the libraries and header files needed for developing Python extensions.
python-related packages. By convention, the names of these packages have a python prefix or suffix. Such packages are either library extensions or python bindings to an existing library. For instance, dbus-python is a Python language binding for D-Bus.
*.pyc*.pyo*.soman python. You can also install python-docs, which provides HTML manuals and references in the following location:
file:///usr/share/doc/python-docs-version/html/index.html
pydoc component_name. For example, pydoc math will display the following information about the math Python module:
Help on module math:

NAME
	math

FILE
	/usr/lib64/python2.6/lib-dynload/mathmodule.so

DESCRIPTION
	This module is always available.  It provides access to the
	mathematical functions defined by the C standard.

FUNCTIONS
	acos[...]
		acos(x)

		Return the arc cosine (measured in radians) of x.

	acosh[...]
		acosh(x)

		Return the hyperbolic arc cosine (measured in radians) of x.

	asin(...)
		asin(x)

		Return the arc sine (measured in radians) of x.

	asinh[...]
		asinh(x)

		Return the hyperbolic arc sine (measured in radians) of x.
java-1.6.0-openjdk package adds support for the Java programming language. This package provides the java interpreter. The java-1.6.0-openjdk-devel package contains the javac compiler, as well as the libraries and header files needed for developing Java extensions.
java-related packages. By convention, the names of these packages have a java prefix or suffix.
man java. Some associated utilities also have their own respective man pages.
javadoc suffix (e.g. dbus-java-javadoc).
ruby package provides the Ruby interpreter and adds support for the Ruby programming language. The ruby-devel package contains the libraries and header files needed for developing Ruby extensions.
ruby-related packages. By convention, the names of these packages have a ruby or rubygem prefix or suffix. Such packages are either library extensions or Ruby bindings to an existing library. For instance, ruby-dbus is a Ruby language binding for D-Bus.
ruby-related packages include:
file:///usr/share/doc/ruby-version/NEWS
file:///usr/share/doc/ruby-version/NEWS-version
gem2rpm tool may not work as expected on a Red Hat Enterprise Linux 6 default ruby environment. For information on how to work around this, refer to http://fedoraproject.org/wiki/Packaging/Ruby#Ruby_Gems.
man ruby. You can also install ruby-docs, which provides HTML manuals and references in the following location:
file:///usr/share/doc/ruby-docs-version/
perl package adds support for the Perl programming language. This package provides Perl core modules, the Perl Language Interpreter, and the PerlDoc tool.
perl-* prefix. These modules provide stand-alone applications, language extensions, Perl libraries, and external library bindings.
perl-5.10.1. If you are running an older system, rebuild or alter external modules and applications accordingly in order to ensure optimum performance.
yum or rpm from the Red Hat Enterprise Linux repositories. They are installed to /usr/share/perl5 and either /usr/lib/perl5 for 32bit architectures or /usr/lib64/perl5 for 64bit architectures.
cpan tool provided by the perl-CPAN package to install modules directly from the CPAN website. They are installed to /usr/local/share/perl5 and either /usr/local/lib/perl5 for 32bit architectures or /usr/local/lib64/perl5 for 64bit architectures.
/usr/share/perl5/vendor_perl and either /usr/lib/perl5/vendor_perl for 32bit architectures or /usr/lib64/perl5/vendor_perl for 64bit architectures.
/usr/share/perl5/vendor_perl and either /usr/lib/perl5/vendor_perl for 32bit architectures or /usr/lib64/perl5/vendor_perl for 64bit architectures.
/usr/share/man directory.
perldoc tool provides documentation on language and core modules. To learn more about a module, use perldoc module_name. For example, perldoc CGI will display the following information about the CGI core module:
NAME
	CGI - Handle Common Gateway Interface requests and responses

SYNOPSIS
	use CGI;

	my $q = CGI->new;

[...]

DESCRIPTION
	CGI.pm is a stable, complete and mature solution for processing and preparing HTTP requests and responses.  Major features including processing form submissions, file uploads, reading and writing cookies, query string generation and manipulation, and processing and preparing HTTP headers. Some HTML generation utilities are included as well.

[...]

PROGRAMMING STYLE
		There are two styles of programming with CGI.pm, an object-oriented style and a function-oriented style.  In the object-oriented style you create one or more CGI objects and then use object methods to create the various elements of the page.  Each CGI object starts out with the list of named parameters that were passed to your CGI script by the server.

[...]
perldoc -f function_name. For example, perldoc -f split wil display the following indormation about the split function:
split /PATTERN/,EXPR,LIMIT
split /PATTERN/,EXPR
split /PATTERN/
split   Splits the string EXPR into a list of strings and returns that list.  By default, empty leading fields are preserved, and empty trailing ones are deleted.  (If all fields are empty, they are considered to be trailing.)

In scalar context, returns the number of fields found. In scalar and void context it splits into the @_ array.  Use of split in scalar and void context is deprecated, however, because it clobbers your subroutine arguments.

If EXPR is omitted, splits the $_ string.  If PATTERN is also omitted, splits on whitespace (after skipping any leading whitespace).  Anything matching PATTERN is taken to be a delimiter separating the fields.  (Note that the delimiter may be longer than one character.)

[...]
gcc and g++), run-time libraries (like libgcc, libstdc++, libgfortran, and libgomp), and miscellaneous other utilities.
-std=c++0x (which disables GNU extensions) or -std=gnu++0x.
-mavx is used.
-Wabi can be used to get diagnostics indicating where these constructs appear in source code, though it will not catch every single case. This flag is especially useful for C++ code to warn whenever the compiler generates code that is known to be incompatible with the vendor-neutral C++ ABI.
-fabi-version=1 option. This practice is not recommended. Objects created this way are indistinguishable from objects conforming to the current stable ABI, and can be linked (incorrectly) amongst the different ABIs, especially when using new compilers to generate code to be linked with old libraries that were built with tools prior to RHEL4.
ld (distributed as part of the binutils package) or in the dynamic loader (ld.so, distributed as part of the glibc package) can subtly change the object files that the compiler produces. These changes mean that object files moving to the current release of Red Hat Enterprise Linux from previous releases may loose functionality, behave differently at runtime, or otherwise interoperate in a diminished capacity. Known problem areas include:
ld --build-id
ld by default, whereas RHEL5 ld doesn't recognize it.
as .cfi_sections support
.debug_frame, .eh_frame or both to be emitted from .cfi* directives. In RHEL5 only .eh_frame is emitted.
as, ld, ld.so, and gdb STB_GNU_UNIQUE and %gnu_unique_symbol support
DWARF standard, and also on new extensions not yet standardized. In RHEL5, tools like as, ld, gdb, objdump, and readelf may not be prepared for this new information and may fail to interoperate with objects created with the newer tools. In addition, RHEL5 produced object files do not support these new features; these object files may be handled by RHEL6 tools in a sub-optimal manner.
prelink.
compat-gcc-34
compat-gcc-34-c++
compat-gcc-34-g77
compat-libgfortran-41
gcc44 as an update. This is a backport of the RHEL6 compiler to allow users running RHEL5 to compile their code with the RHEL6 compiler and experiment with new features and optimizations before upgrading their systems to the next major release. The resulting binary will be forward compatible with RHEL6, so one can compile on RHEL5 with gcc44 and run on RHEL5, RHEL6, and above.
gcc44 compiler will be kept reasonably in step with the GCC 4.4.x that we ship with RHEL6 to ease transition. Though, to get the latest features, it is recommended RHEL6 is used for development. The gcc44 is only provided as an aid in the conversion process.
binutils and gcc; doing so will also install several dependencies.
gcc command. This is the main driver for the compiler. It can be used from the command line to pre-process or compile a source file, link object files and libraries, or perform a combination thereof. By default, gcc takes care of the details and links in the provided libgcc library.
CDT. This presents many advantages, particularly for developers who prefer a graphical interface and fully integrated environment. For more information about compiling in Eclipse, refer to Section 1.3, “
Development Toolkits”.
#include <stdio.h>

int main ()
{
  printf ("Hello world!\n");
  return 0;
}
gcc hello.c -o hello
hello is in the same directory as hello.c.
hello binary, i.e. hello.
#include <iostream>

using namespace std;

int main(void)
{
  cout << "Hello World!" << endl;
  return 0;
}
g++ hello.cc -o hello
hello is in the same directory as hello.cc.
hello binary, i.e. hello.
#include <stdio.h>
void hello()
{
  printf("Hello world!\n");
}
extern void hello();

int main()
{
  hello();
  return 0;
}
gcc -c one.c -o one.o
one.o is in the same directory as one.c.
gcc -c two.c -o two.o
two.o is in the same directory as two.c.
one.o and two.o into a single executable with:
gcc one.o two.o -o hello
hello is in the same directory as one.o and two.o.
hello binary, i.e. hello.
-mtune= option to optimize the instruction scheduling, and -march= option to optimize the instruction selection should be used.
-mtune= optimizes instruction scheduling to fit your architecture by tuning everything except the ABI and the available instruction set. This option will not chose particular instructions, but instead will tune your program in such a way that executing on a particular architecture will be optimized. For example, if an Intel Core2 CPU will predominantly be used, choose -march=core2. If the wrong choice is made, the program will still run, but not optimally on the given architecture. The architecture on which the program will most likely run should always be chosen.
-march= optimizes instruction selection. As such, it is important to choose correctly as choosing incorrectly will cause your program to fail. This option selects the instruction set used when generating code. For example, if the program will be run on an AMD K8 core based CPU, choose -march=k8. Specifying the architecture with this option will imply -mtune=.
-mtune= and -march= commands should only be used for tuning and selecting instructions within a given architecture, not to generate code for a different architecture (also known as cross-compiling). For example, this is not to be used to generate PowerPC code from an Intel 64 and AMD64 platform.
-march= and -mtune=, refer to the GCC documention available here: GCC 4.4.4 Manual: Hardware Models and Configurations
-O2 is a good middle of the road option to generate fast code. It produces the best optimized code when the resulting code size is not large. Use this when unsure what would best suit.
-O3 is preferrable. This option produces code that is slightly larger but runs faster because of a more frequent inline of functions. This is ideal for floating point intensive code.
-Os. This flag also optimizes for size, and produces faster code in situations where a smaller footprint will increase code locality, thereby reducing cache misses.
-frecord-gcc-switches when compiling objects. This records the options used to build objects into objects themselves. After an object is built, it determines which set of options were used to build it. The set of options are then recorded in a section called .GCC.command.line within the object and can be examined with the following:
$ gcc -frecord-gcc-switches -O3 -Wall hello.c -o hello
$ readelf --string-dump=.GCC.command.line hello

String dump of section '.GCC.command.line':
  [     0]  hello.c
  [     8]  -mtune=generic
  [    17]  -O3
  [    1b]  -Wall
  [    21]  -frecord-gcc-switches
Step One
-fprofile-generate.
Step Two
Step Three
-fprofile-use.
source.c to include profiling instrumentation:
gcc source.c -fprofile-generate -O2 -o executable
executable to gather profiling information:
./executable
source.c with profiling information gathered in step one:
gcc source.c -fprofile-use -O2 -o executable
-fprofile-dir=DIR where DIR is the preferred output directory.
glibc and libgcc, and possibly for libstdc++ if the program is a C++ program. On Intel 64 and AMD64, this can be done with:
yum install glibc-devel.i686 libgcc.i686 libstdc++-devel.i686
db4-devel libraries to build, the 32-bit version of these libraries can be installed with:
yum install db4-devel.i686
.i686 suffix on the x86 platform (as opposed to x86-64) specifies a 32-bit version of the given package. For PowerPC architectures, the suffix is ppc (as opposed to ppc64).
-m32 option can be passed to the compiler and linker to produce 32-bit executables. Provided the supporting 32-bit libraries are installed on teh 64-bit system, this executable will be able to run on both 32-bit systems and 64-bit systems.
hello.c into a 64-bit executable with:
gcc hello.c -o hello64
$ file hello64
hello64: ELF 64-bit LSB executable, x86-64, version 1 (GNU/Linux), dynamically linked (uses shared libs), for GNU/Linux 2.6.18, not stripped
$ ldd hello64
linux-vdso.so.1 =>  (0x00007fff242dd000)
libc.so.6 => /lib64/libc.so.6 (0x00007f0721514000)
/lib64/ld-linux-x86-64.so.2 (0x00007f0721893000)
file on a 64-bit executable will include ELF 64-bit in its output, and ldd will list /lib64/libc.so.6 as the main C library linked.
hello.c into a 32-bit executable with:
gcc -m32 hello.c -o hello32
$ file hello32
hello32: ELF 32-bit LSB executable, Intel 80386, version 1 (GNU/Linux), dynamically linked (uses shared libs), for GNU/Linux 2.6.18, not stripped
$ ldd hello32
linux-gate.so.1 =>  (0x007eb000)
libc.so.6 => /lib/libc.so.6 (0x00b13000)
/lib/ld-linux.so.2 (0x00cd7000)
file on a 32-bit executable will include ELF 32-bit in its output, and ldd will list /lib/libc.so.6 as the main C library linked.
$ gcc -m32 hello32.c -o hello32
/usr/bin/ld: crt1.o: No such file: No such file or directory
collect2: ld returned 1 exit status
$ g++ -m32 hello32.cc -o hello32-c++
In file included from /usr/include/features.h:385,
     from /usr/lib/gcc/x86_64-redhat-linux/4.4.4/../../../../include/c++/4.4.4/x86_64-redhat-linux/32/bits/os_defines.h:39,
     from /usr/lib/gcc/x86_64-redhat-linux/4.4.4/../../../../include/c++/4.4.4/x86_64-redhat-linux/32/bits/c++config.h:243,
     from /usr/lib/gcc/x86_64-redhat-linux/4.4.4/../../../../include/c++/4.4.4/iostream:39,
     from hello32.cc:1:
/usr/include/gnu/stubs.h:7:27: error: gnu/stubs-32.h: No such file or directory
-m32 will in not adapt or convert a program to resolve any issues arising from 32/64-bit incompatibilities. For tips on writing portable code and converting from 32-bits to 64-bits, see the paper entitled Porting to 64-bit GNU/Linux Systems in the Proceedings of the 2003 GCC Developers Summit.
man pages for cpp, gcc, g++, gcj, and gfortran.
distcc package provides this capability.
distcc
distcc-server
man pages for distcc and distccd. The following link also provides detailed information about the development of distcc:
configure script. This script runs prior to builds and creates the top-level Makefiles needed to build the application. The configure script may perform tests on the current system, create additional files, or run other directives as per parameters provided by the builder.
configure script from an input file (e.g. configure.ac)
Makefile for a project on a specific system
configure.scan), which can be edited to create a final configure.ac to be used by autoconf
Development Tools group package. You can install this package group to install the entire Autotools suite, or simply use yum to install any tools in the suite as you wish.
git or mercurial into Eclipse. As such, Autotools projects that use git repositories will need to be checked out outside the Eclipse workspace. Afterwards, you can specify the source location for such projects in Eclipse. Any repository manipulation (e.g. commits, updates) will need to be done via the command line.
configure script. This script tests systems for tools, input files, and other features it can use in order to build the project [2]. The configure script generates a Makefile which allows the make tool to build the project based on the system configuration.
configure script, create an input file and feed it to an Autotools utility to create theconfigure script. This input file is typically configure.ac or Makefile.am; the former is usually processed by autoconf, while the latter is fed to automake.
Makefile.am input file is available, the automake utility creates a Makefile template (i.e. Makefile. in), which may refer to information collected at configuration time. For example, the Makefile may need to link to a particular library if and only if that library is already installed. When the configure script runs, automake will use the Makefile. in templates to create a Makefile.
configure.ac file is available instead, then autoconf will automatically create the configure script based on the macros invoked by configure.ac. To create a preliminary configure.ac, use the autoscan utility and edit the file accordingly.
man pages for autoconf, automake, autoscan and most tools included in the Autotools suite. In addition, the Autotools community provides extensive documentation on autoconf and automake on the following websites:
hello program:
.spec files. This plug-in allows users to leverage several Eclipse GUI features in editing .spec files, such as auto-completion, highlighting, file hyperlinks, and folding.
rpmlint tool into the Eclipse interface. rpmlint is a command-line tool that helps developers detect common RPM package errors. The richer visualization offered by the Eclipse interface helps developers quickly detect, view, and correct mistakes reported by rpmlint.
eclipse-rpm-editor package. For more information about this plug-in, refer to Specfile Editor User Guide in the Eclipse .
-debuginfo packages for all architecture-dependent RPMs included in the operating system. A -debuginfo package contains accurate debugging information for its corresponding package. To install the -debuginfo package of a package (i.e. typically packagename-debuginfodebuginfo-install packagename
-debuginfo equivalent installed may fail, although GDB will try to provide any helpful diagnostics it can.
-g flag.
br (breakpoint)r (run)run command starts the execution of the program. If run is executed with any arguments, those arguments are passed on to the executable as if the program has been started normally. Users normally issue this command after setting breakpoints.
p (print)print command displays the value of the argument given, and that argument can be almost anything relevant to the program. Usually, the argument is simply the name of a variable of any complexity, from a simple single value to a structure. An argument can also be an expression valid in the current language, including the use of program variables and library functions, or functions defined in the program beingtested.
bt (backtrace)backtrace displays the chain of function calls used up until the exectuion was terminated. This is useful for investigating serious bugs (such as segmentation faults) with elusive causes.
l (list)list command shows the line in the source code corresponding to where the program stopped.
c (continue)continue command simply restarts the execution of the program, which will continue to execute until it encounters a breakpoint, runs into a specified or emergent condition (e.g. an error), or terminates.
n (next)continue, the next command also restarts execution; however, in addition to the stopping conditions implicit in the continue command, next will also halt execution at the next sequential line of code in the current source file.
s (step)next, the step command also halts execution at each sequential line of code in the current source file. However, if execution is currently stopped at a source line containing a function call, GDB stops execution after entering the function call (rather than executing it).
fini (finish)finish command resumes executions, but halts when execution returns from a function.
q (quit)h (help)help command provides access to its extensive internal documentation. The command takes arguments: help breakpoint (or h br), for example, shows a detailed description of the breakpoint command. Refer to the help output of each command for more detailed information.
#include <stdio.h>

    char hello[] = { "Hello, World!" };

    int
    main()
    {
      fprintf (stdout, "%s\n", hello);
      return (0);
    }
gcc -g -o hello hello.c
hello is in the same directory as hello.c.
gdb on the hello binary, i.e. gdb hello.
gdb will display the default GDB prompt:
(gdb)
hello is global, so it can be seen even before the main procedure starts:
    gdb) p hello
    $1 = "Hello, World!"
    (gdb) p hello[0]
    $2 = 72 'H'
    (gdb) p *hello
    $3 = 72 'H'
    (gdb)
print targets hello[0] and *hello require the evaluation of an expression, as does, for example, *(hello + 1):
    (gdb) p *(hello + 1)
    $4 = 101 'e'
    (gdb) l
    1       #include <stdio.h>
    2
    3       char hello[] = { "Hello, World!" };
    4
    5       int
    6       main()
    7       {
    8         fprintf (stdout, "%s\n", hello);
    9         return (0);
    10      }
list reveals that the fprintf call is on line 8. Apply a breakpoint on that line and resume the code:
    (gdb) br 8
    Breakpoint 1 at 0x80483ed: file hello.c, line 8.
    (gdb) r
    Starting program: /home/moller/tinkering/gdb-manual/hello

    Breakpoint 1, main () at hello.c:8
    8         fprintf (stdout, "%s\n", hello);
fprintf call, executing it:
    (gdb) n
    Hello, World!
    9         return (0);
continue command thousands of times just to get to the iteration that crashed.
      #include <stdio.h>

      main()
      {
        int i;

        for (i = 0;; i++) {
          fprintf (stdout, "i = %d\n", i);
        }
      }
      (gdb) br 8 if i == 8936
      Breakpoint 1 at 0x80483f5: file iterations.c, line 8.
      (gdb) r
      i = 8931
      i = 8932
      i = 8933
      i = 8934
      i = 8935

      Breakpoint 1, main () at iterations.c:8
      8           fprintf (stdout, "i = %d\n", i);
info br) to review the breakpoint status:
      (gdb) info br
      Num     Type           Disp Enb Address    What
      1       breakpoint     keep y   0x080483f5 in main at iterations.c:8
              stop only if i == 8936
              breakpoint already hit 1 time
gdb child isn't always possible.
exec function to start a completely independent executable. In the same manner, threads use multiple paths of execution, occurring simultaneously in the same executable. This can provide a whole new range of debugging challenges, such as setting a breakpoint for a particular thread that won't interrupt the execution of any other thread. GDB supports threaded debugging (but not in all architectures for which GDB can be built).
info emacs; additional information on this is also available from the following link:
info gdb; this provides access to the GDB info file included in the GDB installation. In addition, man gdb offers more concise GDB information.
-fno-var-tracking-assignments. In addition, the VTA infrastructure includes the new gcc option -fcompare-debug. This option tests code compiled by GCC with debug information and without debug information: the test passes if the two binaries are identical. This test ensures that executable code is not affected by any debugging options, which further ensures that there are no hidden bugs in the debug code. Note that -fcompare-debug adds significant cost in compilation time. Refer to man gcc for details about this option.
print outputs comprehensive debugging information for a target application. GDB aims to provide as much debugging data as it can to users; however, this means that for highly complex programs the amount of data can become very cryptic.
print output. GDB does not even empower users to easily create tools that can help decipher program data. This makes the practice of reading and understanding debugging data quite arcane, particularly for large, complex projects.
print output (and make it more meaningful) is to revise and recompile GDB. However, very few developers can actually do this. Further, this practice will not scale well, particularly if the developer needs to also debug other programs that are heterogenous and contain equally complex debugging data.
perf, and SystemTap) to collect profiling data. Each tool is suitable for performing specific types of profile runs, as described in the following sections.
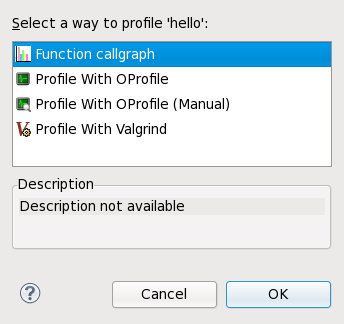
malloc, new, free, and delete. Memcheck is perhaps the most used Valgrind tool, as memory management problems can be difficult to detect using other means. Such problems often remain undetected for long periods, eventually causing crashes that are difficult to diagnose.
cachegrind, callgrind can model cache behavior. However, the main purpose of callgrind is to record callgraphs data for the executed code.
lackey tool, which is a sample that can be used as a template for generating your own tools.
valgrind package and its dependencies install all the necessary tools for performing a Valgrind profile run. To profile a program with Valgrind, use:
valgrind --tool=toolname program
toolnamenone is also a valid argument for toolname--log-file=filename. For example, to check the memory usage of the executable file hello and send profile information to output, use:
valgrind --tool=memcheck --log-file=output hello
eclipse-valgrind package. For more information about this plug-in, refer to Valgrind Integration User Guide in the Eclipse .
man valgrind. Red Hat Enterprise Linux 6 also provides a comprehensive Valgrind Documentation book, available as PDF and HTML in:
file:///usr/share/doc/valgrind-version/valgrind_manual.pdf
file:///usr/share/doc/valgrind-version/html/index.html
eclipse-valgrind package.
x number of events (e.g. cache misses or branch instructions). Each sample also contains information on where it occurred in the program.
oprofiled), running the program to be profiled, collecting the system profile data, and parsing it into a more understandable format. OProfile provides several tools for every step of this process.
opreport command outputs binary image summaries, or per-symbol data, from OProfile profiling sessions.
opannotate command outputs annotated source and/or assembly from the profile data of an OProfile session.
oparchive command generates a directory populated with executable, debug, and OProfile sample files. This directory can be moved to another machine (via tar), where it can be analyzed offline.
opreport, the opgprof command outputs profile data for a given binary image from an OProfile session. The output of opgprof is in gprof format.
man oprofile. For detailed information on each OProfile command, refer to its corresponding man page. Refer to Section 6.3.4, “OProfile Documentation” for other available documentation on OProfile.
oprofile package and its dependencies install all the necessary utilities for performing an OProfile profile run. To instruct the OProfile to profile all the application running on the system and to group the samples for the shared libraries with the application using the library, run the following command as root:
opcontrol --no-vmlinux --separate=library --start
--start-daemon instead. The --stop option halts data collection, while the --shutdown terminates the OProfile daemon.
opreport, opannotate, or opgprof to display the collected profiling data. By default, the data collected by the OProfile daemon is stored in /var/lib/oprofile/samples/.
eclipse-oprofile package. For more information about this plug-in, refer to OProfile Integration User Guide in the Eclipse (also provided by eclipse-profile).
man oprofile. Red Hat Enterprise Linux 6 also provides two comprehensive guides to OProfile in file:///usr/share/doc/oprofile-version/:
file:///usr/share/doc/oprofile-version/oprofile.html
file:///usr/share/doc/oprofile-version/internals.html
eclipse-oprofile package.
kernel-variant-devel-versionkernel-variant-debuginfo-versionkernel-variant-debuginfo-common-versionsudo) access to their own machines. In addition, full SystemTap functionality should also be restricted to privileged users, as this can provide the ability to completely take control of a system.
--unprivileged. This option allows an unprivileged user to run stap. Of course, several restrictions apply to unprivileged users that attempt to run stap.
stapusr but is not a member of the group stapdev (and is not root).
--unprivileged option is used, the server checks the script against the constraints imposed for unprivileged users. If the checks are successful, the server compiles the script and signs the resulting module using a self-generated certificate. When the client attempts to load the module, staprun first verifies the signature of the module by checking it against a database of trusted signing certificates maintained and authorized by root.
staprun is assured that:
--unprivileged option.
--unprivileged option.
stap-server initscript are automatically authorized to receive connections from all clients on the same host.
stap-server is automatically authorized as a trusted signer on the host in which it runs. If the compile server was initiated through other means, it is not automatically authorized as such.
systemtap package:
file:///usr/share/doc/systemtap-version/SystemTap_Beginners_Guide/index.html
file:///usr/share/doc/systemtap-version/SystemTap_Beginners_Guide.pdf
file:///usr/share/doc/systemtap-version/tapsets/index.html
file:///usr/share/doc/systemtap-version/tapsets.pdf
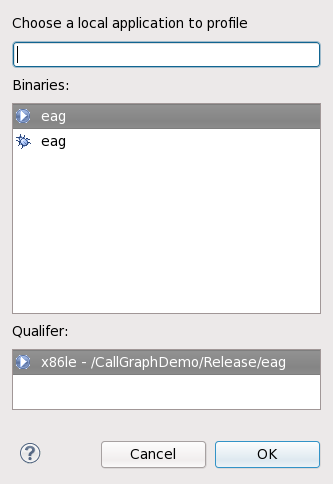
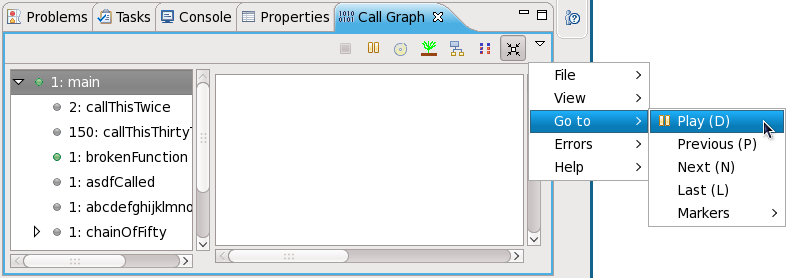
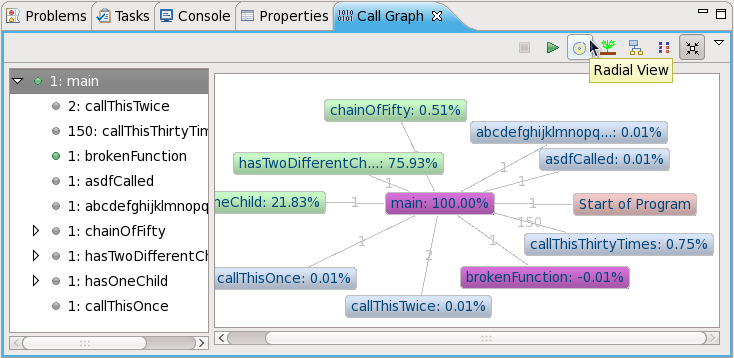
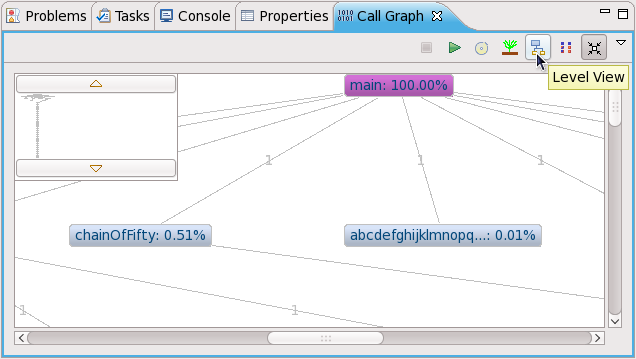
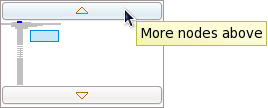
main(), with each function represented as a node. A purple node means that the program terminates at the function. A green node signifies that the function call has nested functions, whereas gray nodes signify no nest functions. Double-clicking on a node will show its parent (colored pink) and children. The lines connecting different nodes also display how many times main() called each function.
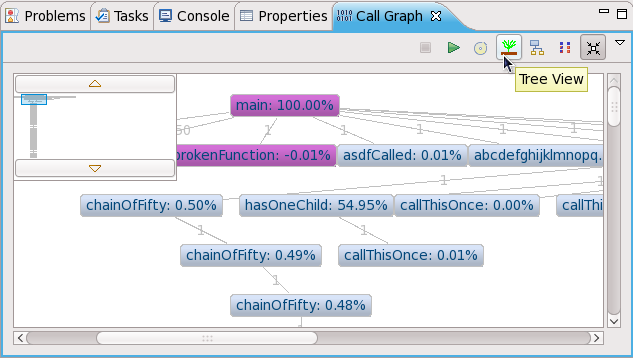
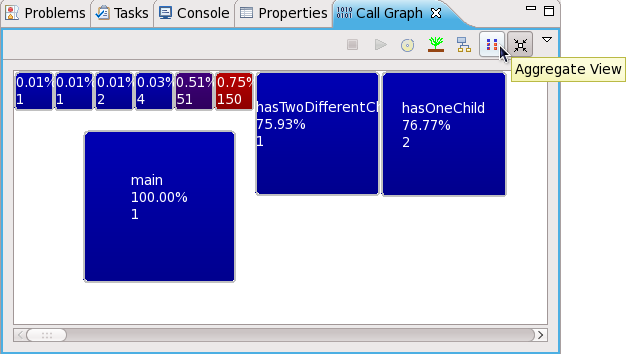
CallThisThirtyTimes function is called the most number of times (150).

perf to analyze the collected performance data.
perf commands include the following:
perf command provides overall statistics for common performance events, including instructions executed and clock cycles consumed. Options allow selection of events other than the default measurement events.
perf command records performance data into a file which can be later analyzed using perf report.
perf command reads the performance data from a file and analyzes the recorded data.
perf command lists the events available on a particular machine. These events will vary based on the performance monitoring hardware and the software configuration of the system.
perf help to obtain a complete list of perf commands. To retrieve man page information on each perf command, use perf help command.
make and its children, use the following command:
perf stat -- make all
perf command will collect a number of different hardware and software counters. It will then print the following information:
Performance counter stats for 'make all':

  244011.782059  task-clock-msecs         #      0.925 CPUs
          53328  context-switches         #      0.000 M/sec
            515  CPU-migrations           #      0.000 M/sec
        1843121  page-faults              #      0.008 M/sec
   789702529782  cycles                   #   3236.330 M/sec
  1050912611378  instructions             #      1.331 IPC
   275538938708  branches                 #   1129.203 M/sec
     2888756216  branch-misses            #      1.048 %
     4343060367  cache-references         #     17.799 M/sec
      428257037  cache-misses             #      1.755 M/sec

  263.779192511  seconds time elapsed
perf tool can also record samples. For example, to record data on the make command and its children, use:
perf record -- make all
[ perf record: Woken up 42 times to write data ]
[ perf record: Captured and wrote 9.753 MB perf.data (~426109 samples) ]
perf.data to determine the relative frequency of samples. The report output includes the command, object, and function for the samples. Use perf report to output an analysis of perf.data. For example, the following command produces a report of the executable that consumes the most time:
perf report --sort=comm
# Samples: 1083783860000
#
# Overhead          Command
# ........  ...............
#
    48.19%         xsltproc
    44.48%        pdfxmltex
     6.01%             make
     0.95%             perl
     0.17%       kernel-doc
     0.05%          xmllint
     0.05%              cc1
     0.03%               cp
     0.01%            xmlto
     0.01%               sh
     0.01%          docproc
     0.01%               ld
     0.01%              gcc
     0.00%               rm
     0.00%              sed
     0.00%   git-diff-files
     0.00%             bash
     0.00%   git-diff-index
make spends most of this time in xsltproc and the pdfxmltex. To reduce the time for the make to complete, focus on xsltproc and pdfxmltex. To list of the functions executed by xsltproc, run:
perf report -n --comm=xsltproc
comm: xsltproc
# Samples: 472520675377
#
# Overhead  Samples                    Shared Object  Symbol
# ........ ..........  .............................  ......
#
    45.54%215179861044  libxml2.so.2.7.6               [.] xmlXPathCmpNodesExt
    11.63%54959620202  libxml2.so.2.7.6               [.] xmlXPathNodeSetAdd__internal_alias
     8.60%40634845107  libxml2.so.2.7.6               [.] xmlXPathCompOpEval
     4.63%21864091080  libxml2.so.2.7.6               [.] xmlXPathReleaseObject
     2.73%12919672281  libxml2.so.2.7.6               [.] xmlXPathNodeSetSort__internal_alias
     2.60%12271959697  libxml2.so.2.7.6               [.] valuePop
     2.41%11379910918  libxml2.so.2.7.6               [.] xmlXPathIsNaN__internal_alias
     2.19%10340901937  libxml2.so.2.7.6               [.] valuePush__internal_alias
ftrace framework provides users with several tracing capabilities, accessible through an interface much simpler than SystemTap's. This framework uses a set of virtual files in the debugfs file system; these files enable specific tracers. The ftrace function tracer simply outputs each function called in the kernel in real time; other tracers within the ftrace framework can also be used to analyze wakeup latency, task switches, kernel events, and the like.
ftrace, making it a flexible solution for analyzing kernel events. The ftrace framework is useful for debugging or analyzing latencies and performance issues that take place outside of user-space. Unlike other profilers documented in this guide, ftrace is a built-in feature of the kernel.
CONFIG_FTRACE=y option. This option provides the interfaces needed by ftrace. To use ftrace, mount the debugfs file system as follows:
mount -t debugfs nodev /sys/kernel/debug
ftrace utilities are located in /sys/kernel/debug/tracing/. View the /sys/kernel/debug/tracing/available_tracers file to find out what tracers are available for your kernel:
cat /sys/kernel/debug/tracing/available_tracers
power wakeup irqsoff function sysprof sched_switch initcall nop
/sys/kernel/debug/tracing/current_tracer. For example, wakeup traces and records the maximum time it takes for the highest-priority task to be scheduled after the task wakes up. To use it:
echo wakeup > /sys/kernel/debug/tracing/current_tracer
/sys/kernel/debug/tracing/tracing_on, as in:
echo 1 > /sys/kernel/debug/tracing/tracing_on (enables tracing)
echo 0 > /sys/kernel/debug/tracing/tracing_on (disables tracing)
/sys/kernel/debug/tracing/trace, but is meant to be piped into a command. Unlike /sys/kernel/debug/tracing/trace, reading from this file consumes its output.
| Revision History | |||
|---|---|---|---|
| Revision 1.0 | Thu Oct 08 2009 | ||
| |||