Scilab Home page | Wiki | Bug tracker | Forge | Mailing list archives | ATOMS | File exchange
Please login or create an account
Change language to: Français - Português - Русский - 日本語
Scilab Help >> Sound file handling > analyze

analyze

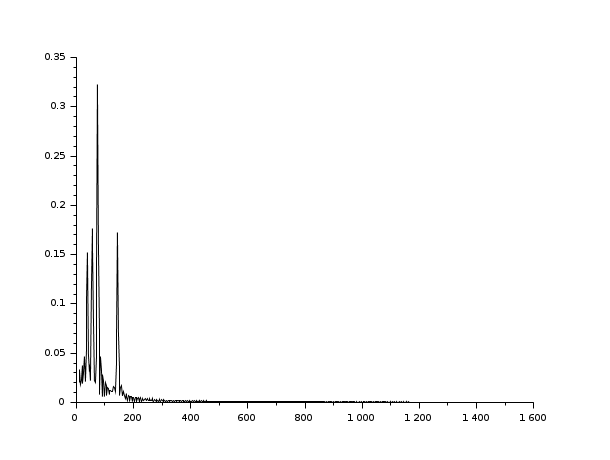
frequency plot of a sound signal

Arguments

fmin,fmax,rate,points

scalars. default values fmin=100,fmax=1500,rate=22050,points=8192;

Description

Make a frequency plot of the signal w with sampling rate rate. The data must be at least points long. The maximal frequency plotted will be fmax, the minimal fmin.

Examples

// At first we create 0.5 seconds of sound parameters.
t=soundsec(0.5);

// Then we generate the sound.
s=sin(440*t)+sin(220*t)/2+sin(880*t)/2;
[nr,nc]=size(t);
s(nc/2:nc)=sin(330*t(nc/2:nc));
analyze(s);
Scilab Enterprises
Copyright (c) 2011-2015 (Scilab Enterprises)
Copyright (c) 1989-2012 (INRIA)
Copyright (c) 1989-2007 (ENPC)
with contributors
Last updated:
Wed Jun 15 08:27:39 CEST 2016