replot
redraw with new boundaries the current or a given set of axes
Syntax
replot(area)
replot(area, axesHandles)
Arguments
- area
row vector [xmin ymin xmax ymax] or [xmin ymin zmin xmax ymax zmax]: new bounds of the area to be replotted.
 Use
Use%nanto keep a bound as is.- axeHandle
Vector of graphics handles of type Axes: Axes to crop. By default, the current Axes of the current figure is considered.
Description
replot is used to redraw the content of the current graphics axes with new boundaries defined by
area = [xmin,ymin, xmax,ymax] or area = [xmin,ymin,zmin, xmax,ymax,zmax].
This transformation can be applied to specific
axes given by Axes graphics handles via the axesHandles argument. If axesHandles is
not specified, the new boundaries are applied to the current axes of the
current figure. The transformation changes the data_bounds
value of those axes.
| The axes property tight_limits
must be set to "on" to strictly select specified bounds (see
axes_properties) |
Examples
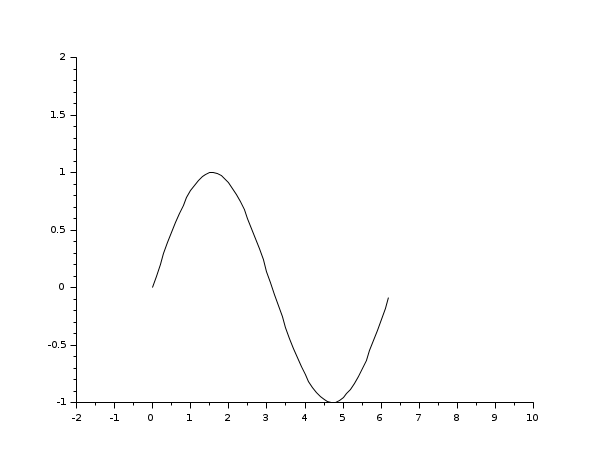
xdel(winsid());
plot() // plot demo
f=gcf();
replot([-1,-1,10,2],f.children(1)) // specify axes handle's value
replot([-3,-2,8,4],f.children(2))
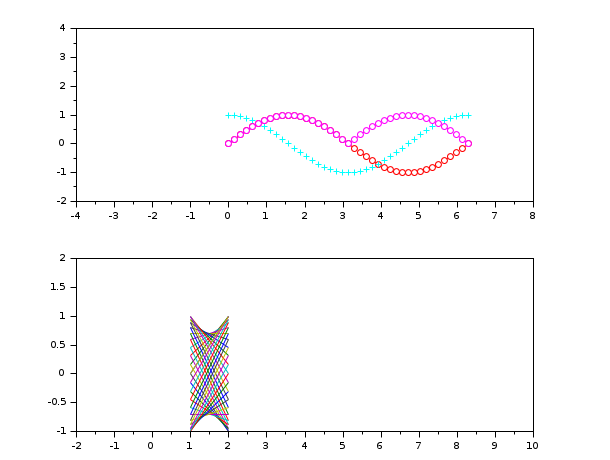
// Leaving some bounds as is with %nan:
x = linspace(0,360,200).';
clf
plot2d(x,[sind(x) tand(x)])
ax = gca();
ax.data_bounds                // initial bounds
replot([%nan,-10,%nan,10])    // only Ymin and Ymax are changed
ax.data_bounds                // updated bounds
// Resizing Z bounds as well as X and Y ones in 3D view:
clf
x = linspace(-4,4,100);
X = meshgrid(x);
R = (X-0.5).^2 + (X.'+0.7).^2;
Z = sinc(R);
surf(x-0.5,x+0.7,Z)
f = gcf();
f.color_map = autumncolormap(100);
ax = gca();
ax.data_bounds
sleep(3000)
replot([-5 0 -0.4 0 5 0.5])
ax.data_bounds
// Resizing several chosen axes together:
clf
x = linspace(-%pi,%pi,400);
subplot(2,2,1)
plot2d(x,sin(1 ./sqrt(abs(x))))
ax1 = gca();
subplot(2,2,2)
plot2d(x,sinh(sqrt(abs(x))))
subplot(2,1,2)
plot2d(x,cos(1 ./sqrt(abs(x))))
ax2 = gca();
sleep(4000)
f = gcf();
replot([-1 %nan 1.5 %nan], [ax1 ax2])
See Also
- zoom_rect — zoom a selection of the current graphic figure
- rubberbox — rubberband box for rectangle selection
- axes_properties — description of the axes entity properties
History
| Version | Description |
| 5.5.0 |
|
Comments
Add a comment:
Please login to comment this page.