- Scilab Help
- Graphics
- 2d_plot
- 3d_plot
- annotation
- axes_operations
- axis
- bar_histogram
- Color management
- Datatips
- figure_operations
- geometric_shapes
- handle
- interaction
- lighting
- load_save
- pie
- polygon
- property
- text
- transform
- window_control
- GlobalProperty
- Graphics: Getting started
- Compound properties
- Graphics Entities
- object editor
- pixel_drawing_mode
- Segments properties
- twinkle
- xchange
- xdel
- xget
- xgetech
- xgraduate
- xgrid
- xname
- xnumb
- xsegs
- xset
- xsetech
xgetech
get the current graphics scale
Syntax
[wrect, frect, logflag, arect] = xgetech()
Arguments
- wrect, frect
real vectors.
- logflag
string of size 2
"xy".
Description
xgetech returns the current graphics scale (of
the current window). The rectangle [xmin, ymin, xmax,
ymax]
given by frect is the size of the
whole graphics window. The plotting will be made in the region of
the current graphics window specified by wrect.
wrect=[x, y, w, h] (upper-left point, width,
height) describes a region inside the graphics window. The values in
wrect are specified using proportion of the width
and height of the graphics window:
wrect=[0, 0, 1, 1] means that the whole graphics
window is used.
wrect=[0.5, 0, 0.5, 1] means that the graphics
region is the right half of the graphics window.
logflag is a string of size 2
"xy", where x and
y can be "n" or
"l". "n" stands for normal (linear) scale and "l" stands for logscale.
x stands for the x-axis and y
stands for the y-axis.
arect = [x_left, x_right, y_up, y_down] gives the
frame size inside the subwindow. The graphic frame is specified
(like wrect) using proportion of the width or
height of the current graphic subwindow. Default value is
1/8*[1,1,1,1]. If arect is not
given, current value remains unchanged.
Examples
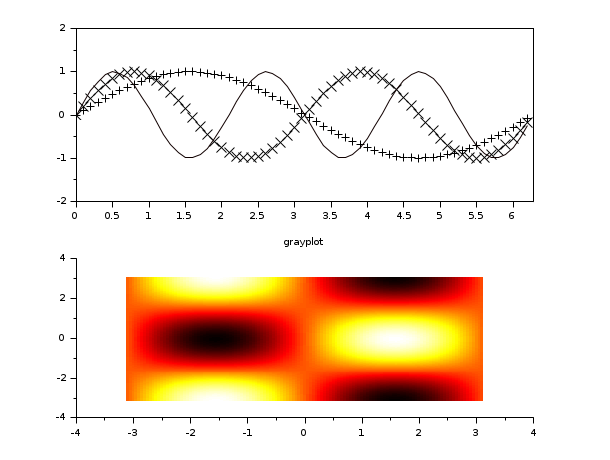
// first subwindow
xsetech([0,0,1.0,0.5])
plot2d()
// then xsetech is used to set the second sub window
xsetech([0,0.5,1.0,0.5])
grayplot()
// get the graphic scales of first subwindow
xsetech([0,0,1.0,0.5])
[wrect,frect,logflag,arect]=xgetech();
// get the graphic scales of second subwindow
xsetech([0,0.5,1.0,0.5])
[wrect,frect,logflag,arect]=xgetech();
See Also
- xsetech — set the sub-window of a graphics window for plotting
Comments
Add a comment:
Please login to comment this page.