Scilab 6.0.0
Scilab Help >> Graphics > text > xstringb
xstringb
draw strings into a box
Syntax
xstringb(x,y,str,w,h,[option])
Arguments
- x,y,w,h
vector of 4 real scalars defining the box.
- str
matrix of strings.
Starting from Scilab 5.2, it is possible to write LaTeX or MathML expression.
- option
string.
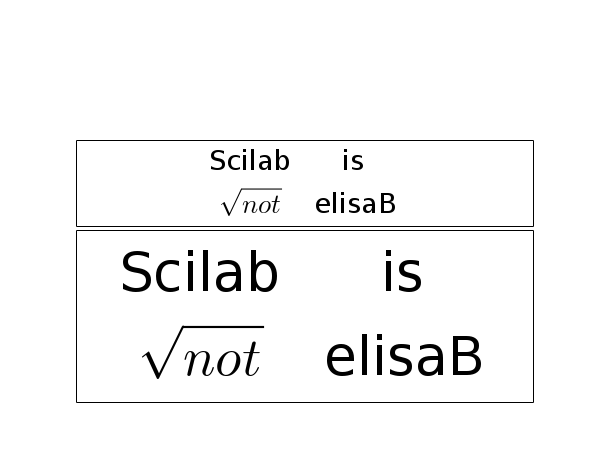
Description
xstringb draws the matrix of strings str centered inside
the rectangle rect=[x,y,w,h]
(lower-left point, width, height) in user coordinates.
If option is given with the value "fill", the character size is
computed so as to fill as much as possible in the rectangle.
Enter the command xstringb() to see a demo.
Comments
Add a comment:
Please login to comment this page.