- Aide de Scilab
- Graphiques
- 2d_plot
- contour2di
- contourf
- errbar
- fec
- fgrayplot
- histplot
- paramfplot2d
- LineSpec
- Matplot
- Matplot1
- Matplot properties
- Sfgrayplot
- Sgrayplot
- champ
- champ1
- champ properties
- comet
- contour2d
- contour2dm
- fchamp
- fec properties
- fplot2d
- grayplot
- grayplot properties
- graypolarplot
- plot
- plot2d
- plot2d2
- plot2d3
- plot2d4
- polarplot
- scatter
champ
2D vector field plot
Syntax
champ(x, y, fx, fy, [arfact, rect, strf])
champ(x, y, fx, fy, <opt_args>)
Arguments
- x, y
two vectors which define the grid.
- fx
a matrix which describes the x component of the vector field.
fx(i,j)is the x component of the vector field at point(x(i),y(j)).- fy
a matrix which describes the y component of the vector field.
fy(i,j)is the y component of the vector field at point(x(i),y(j)).- <opt_args>
This represents a sequence of statements
key1=value1, key2=value2,... wherekey1,key2,... can be one of the following:arfact,rect,strf(see below).- arfact
an optional argument of type
realwhich gives a scale factor for the display of the arrow heads on the plot (default value is1.0).- rect
a vector
rect=[xmin, ymin, xmax, ymax]which gives the boundaries of the graphics frame to use.- strf
a string of length 3 "xyz" which has the same meaning as the
strfparameter ofplot2d. The first characterxhas no effect withchamp.
Description
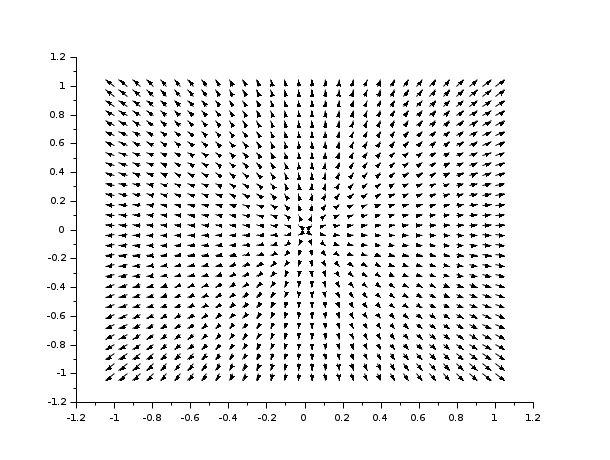
champ draws a 2D vector field. The length of
the arrows is proportional to the intensity of the field.
If you want colored arrows with the color of the arrows depending on
the intensity of the field, use champ1.
Enter the command champ() to see a demo.
Be cautioned about the fact that using meshgrid function before
using champ requires adjustment. For more details, see the last example below.
Examples
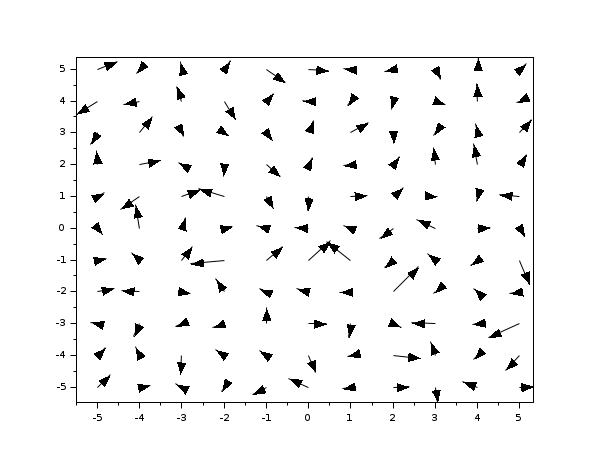
// using rect as plot boundaries
champ(-5:5,-5:5,rand(11,11),rand(11,11),rect=[-10,-10,10,10],arfact=2)
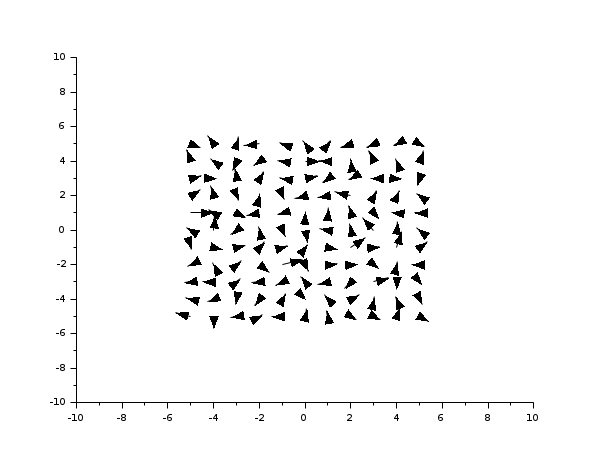
// using (x,y) to get boundaries
clf()
champ(-5:5,-5:5,rand(11,11),rand(11,11),2,[-10,-10,10,10],"021")
// using meshgrid to get fx and fy
clf()
x = linspace(-1,1,30);
y = linspace(-1,1,30);
[X,Y] = meshgrid(x,y);
fy = 2.*Y;
fx = 2.*X;
champ(x,y,fx',fy'); //here we have transposed fx and fy
Comments
where are the first component and the second component from champ(x,x,Fx,Fy) when
we draw different arrows in the graph ?( How to create arrows in the graph ?)
I have already looked for a forum in this site but I can't and I am sorry to write my question here.
Yours faithfully,
Hervé Rabs
e-mail: [email protected]
Add a comment:
Please login to comment this page.