hallchart
Draws the Hall chart
Syntax
hallchart([ modules [,args [,colors]]])
Arguments
- modules
real vector ( modules (in dB))
- args
real vector (phases (in degree))
- colors
a scalar or a vector, the color indices for isogain and iso phase curves
Description
plot the Hall'chart: iso-module and iso-argument contours of
y/(1+y) in the real(y), imag(y) plane
hallchart may be used in conjunction with
nyquist.
The default values for modules and
args are respectively :
[-20 -10 -6 -4 -2 2 4 6 10 20]
[-90 -60 -45 -30 -15 15 30 45 60 90]
This function supersedes the m_circle function
Graphics entities organization
The hallchart function create a single
compound object which is generally the last child of the current
axes. This compound object contains a set of compound objects, one
for each grid curve. The first ones are the iso module curves and
the last one the iso-argument contours. Each of these compound
objects contains a Polyline object (the curve) and a Text object
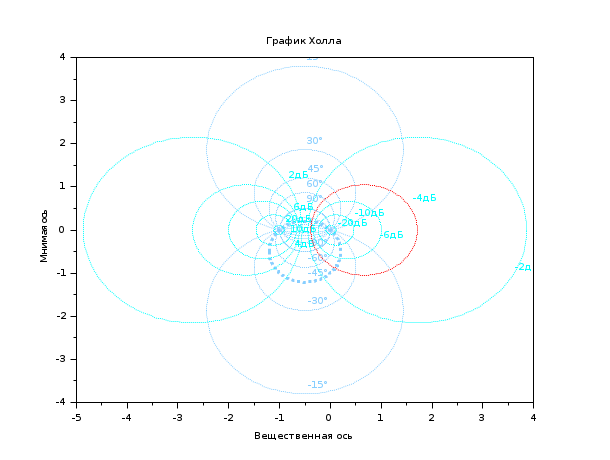
(the label). The following piece of code can be used to change the color of the ith iso module curve:
clf();hallchart()
ax=gca();//handle on current axes
c=ax.children($).children;// the handles on the chart grid curves
i=4; //the index of the -4dB curve
ci=c(i); //the handle on the -4dB curve
ci.children(1).foreground=color('red'); //draw it in red

j=3; // the index of the -45° curve
cj=c(10+j); //the handle on the -45° curve
cj.children(1).thickness=3;//draw it thicker
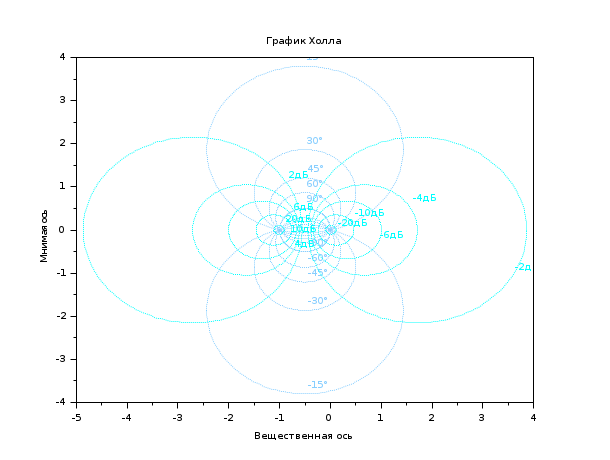
Examples
//Hall chart
clf();hallchart()
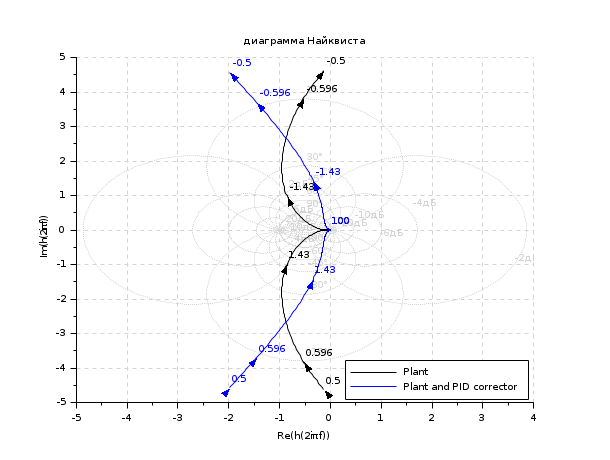
//Hall chart as a grid for nyquist
s=poly(0,'s');
Plant=syslin('c',16000/((s+1)*(s+10)*(s+100)));
//two degree of freedom PID
tau=0.2;xsi=1.2;
PID=syslin('c',(1/(2*xsi*tau*s))*(1+2*xsi*tau*s+tau^2*s^2));
clf();
nyquist([Plant;Plant*PID],0.5,100,["Plant";"Plant and PID corrector"]);
hallchart(colors=color('light gray')*[1 1])
//move the caption in the lower right corner
ax=gca();Leg=ax.children(1);
Leg.legend_location="in_lower_right";
See Also
- nyquist — nyquist plot
- nicholschart — Nichols chart
Comments
Add a comment:
Please login to comment this page.