param3d1
3D plot of parametric curves
Syntax
param3d1(x,y,z,[theta,alpha,leg,flag,ebox])
param3d1(x,y,list(z,colors),[theta,alpha,leg,flag,ebox])
Arguments
- x,y,z
matrices of the same size (nl,nc).
Each column i of the matrices corresponds to the coordinates of the ith curve. You can give a specific color for each curve by using
list(z,colors)instead ofz, wherecolorsis a vector of sizenc. Ifcolor(i)is negative the curve is plotted using the mark with idabs(style(i)); ifstyle(i)is strictly positive, a plain line with color idstyle(i)or a dashed line with dash idstyle(i)is used.- theta,alpha
real values giving in degree the spherical coordinates of the observation point. The default values are 35 and 45 degree.
- leg
string defining the captions for each axis with @ as a field separator, for example "X@Y@Z".
- flag=[type,box]
typeandboxhave the same meaning as inplot3d:- type
an integer (scaling).
- type=0
the plot is made using the current 3D scaling (set by a previous call to
param3d,plot3d,contourorplot3d1).- type=1
rescales automatically 3d boxes with extreme aspect ratios, the boundaries are specified by the value of the optional argument
ebox.- type=2
rescales automatically 3d boxes with extreme aspect ratios, the boundaries are computed using the given data. This is the default value.
- type=3
3d isometric with box bounds given by optional
ebox, similarily totype=1.- type=4
3d isometric bounds derived from the data, similarily
to type=2.- type=5
3d expanded isometric bounds with box bounds given by optional
ebox, similarily totype=1.- type=6
3d expanded isometric bounds derived from the data, similarily to
type=2.Note that axes boundaries can be customized through the axes entity properties (see axes_properties).
- box
an integer (frame around the plot).
- box=0
nothing is drawn around the plot.
- box=1
unimplemented (like box=0).
- box=2
only the axes behind the surface are drawn.
- box=3
a box surrounding the surface is drawn and captions are added.
- box=4
a box surrounding the surface is drawn, captions and axes are added.Note that axes aspect can also be customized through the axes entity properties (see axes_properties). This is the default value.
- ebox
It specifies the boundaries of the plot as the vector
[xmin,xmax,ymin,ymax,zmin,zmax]. This argument is used together withtypeinflag: if it is set to1,3or5(see above to see the corresponding behaviour). Ifflagis missing,eboxis not taken into account. Note that, when specified, theeboxargument acts on thedata_boundsfield that can also be reset through the axes entity properties (see axes_properties). Theeboxdefault value is[0,1,0,1,0,1].
Description
param3d1 is used to plot 3D curves defined by
their coordinates x, y and
z. Note that data can also be got or modified through
the surface entity properties (see surface_properties).
Note that properties like rotation angles,
colors and thickness of the plotted
curves can also be got or modified through the polyline entity properties
(see polyline_properties).
Enter the command param3d1() to see a
demo.
Examples
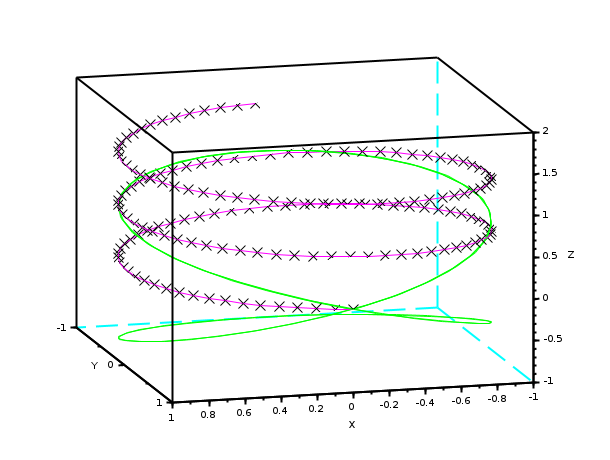
xset('window',20) // create a window number 20
t=[0:0.1:5*%pi]';
param3d1([sin(t),sin(2*t)],[cos(t),cos(2*t)],..
         list([t/10,sin(t)],[3,2]),35,45,"X@Y@Z",[2,3])

xdel(20);
a=gca();//get the handle of the newly created axes
t=[0:0.1:5*%pi]';
param3d1([sin(t),sin(2*t)],[cos(t),cos(2*t)],[t/10,sin(t)]);
a.rotation_angles=[65,75];
a.data_bounds=[-1,-1,-1;1,1,2]; //boundaries given by data_bounds
a.thickness = 2;
h=a.children; //get the handle of the param3d entity: an Compound composed of 2 curves
h.children(1).foreground = 3; // first curve
curve2 = h.children(2);
curve2.foreground = 6;
curve2.mark_style = 2;
Comments
Add a comment:
Please login to comment this page.