Scilab 6.0.0
Справка Scilab >> Графики > polygon > xpolys
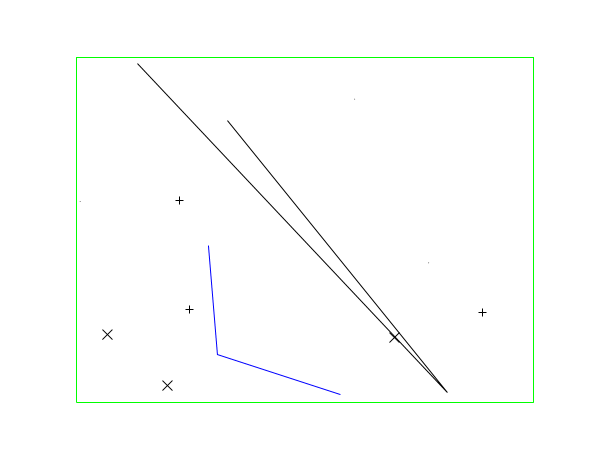
xpolys
draw a set of polylines or polygons
Syntax
xpolys(xpols,ypols,[draw])
Arguments
- xpols,ypols
matrices of the same size (p,n) (points of the polylines).
- draw
vector of size n.
Description
xpolys draws a set of polylinse using marks or dashed lines.
The coordinates of each polyline
are stored in a column of xpols and ypols.
The style of polyline i is given by draw(i):
If
draw(i)is negative, the mark with id-draw(i)is used to draw polyline i (marks are drawn using the current pattern). Usexset()to see the meaning of the ids.If
draw(i)is strictly positive, the line style (or color) with iddraw(i)is used to draw polyline i. Usexset()to see the meaning of the ids.
Comments
Add a comment:
Please login to comment this page.