![]()
![]()
![]()
![]()
|
|
|
|
|
|
||
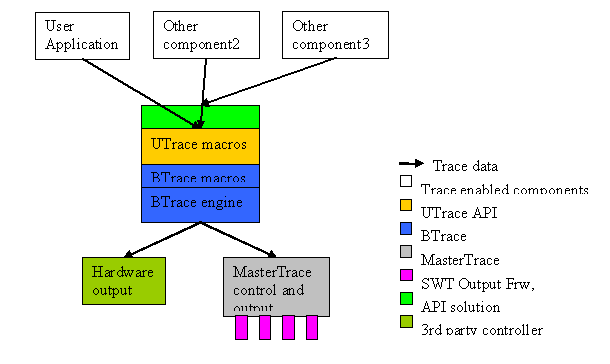
General Purpose Logging provides a system wide trace facility that enables developers to analyse the Symbian OS and diagnose errors.
It creates a unified trace solution (UTRACE) that is based on and extends an existing tracer in Base (BTrace) to build a generic trace mechanism that provides both the trace macros to be used and the engine with which to capture the logs.
The developer injects trace macros into the component (this is called instrumentation) either directly or via an automated plug-in tool. Alternatively, a pre-processor tool can be used to inject traces at compilation time.
The developer then uses filters to ensure only the required trace information is sent to the configured output channel. MasterTrace is the standard logging tool used, but this can be replaced by any similar tool.
The resulting logs are transferred and viewed on a PC. The logs store standard data such as timestamps, the hosting processes or threads, as well as client data such as log types and program specific binary data.
The tracing process consists of three basic phases:
Developer inserts trace macros in the application or component code. Each trace is indentified by a primary filter, and optionally a secondary filter
Developer compiles the application and transfers it to the target
The developer enables the logging of the traces on the target using the provided mechanisms (typically MasterTrace). The developer runs the command line tool on the target and tells it to log traces with the filters used in the trace statement. The logging tool uses filters to decide which traces are to be logged and which discarded
The developer starts the application
The developer stops the logging by calling the MasterTrace command tool
The developer transfers the resulting logs to a PC
The logs are processed, analysed and viewed on screen in a human readable format
|
To use UTrace macros the developer must include the BTrace handler at ROM build time.
Symbian's BTrace handler can be added to ROMs as a kernel extension, which means it is loaded and activated early during boot. To achieve this, the BTRACE macro needs to be defined, e.g.
BUILDROM h2 techview -dBTRACE
To include the required binaries as normal loadable files the file
BTRACE.IBY should be included from another IBY file. In this case
the handler will not be loaded until RBTrace::Open() is
called.
The BTrace binaries are always included in Text-Shell ROMs. To exclude the client DLL, define the macro EXCLUDE_BTRACE, e.g.
ROM rom -variant=h2 -inst=armv5 -build=udeb -d=EXCLUDE_BTRACE
ROMBUILD supports additional keywords for configuring BTrace behaviour. These can be added to any OBY file.
|
There are three basic use cases:
Machine Instrumented Tracing - The developer runs a tool that automatically instruments the component with trace points. This occurs either as a build step or directly on the binary.
Release Product Tracing - The developer manually enters systematic trace points into the component. These trace events in the data and include "interesting" data. The trace points can exist on a released product.
SWT Style Tracing - The developer adds ad-hoc trace points to the component in order to gather run-time information during development. The traces are never released to production.
To include UTrace macros, code to be instrumented must include the following:
#define UTRACE_ENABLED
#include <utrace.h>
Symbian has defined a new set of macros for generating traces that are processed using both primary and secondary filters.
inline TBool UTrace(TUint32 aSecondaryFilter,TPrimaryFilter aPrimaryFilter;
inline TBool UTrace(TUint32 aSecondaryFilter,TPrimaryFilter aPrimaryFilter, TUint32 a1);
inline TBool UTrace(TUint32 aSecondaryFilter,TPrimaryFilter aPrimaryFilter, TUint32 a1, TUint32 a2);
inline TBool UTrace(TUint32 aSecondaryFilter,TPrimaryFilter aPrimaryFilter, TUint32 a1, const TAny* aData, Tint aDataSize);
inline TBool UTrace(TUint32 aSecondaryFilter,TPrimaryFilter aPrimaryFilter, const TAny* aData, Tint aDataSize);

inline TBool UTrace(TPrimaryFilter aPrimaryFilter);
inline TBool UTrace(TPrimaryFilter aPrimaryFilter, TUint32 a1);
inline TBool UTrace(TPrimaryFilter aPrimaryFilter, TUint32 a1,TUint32 a2);
inline TBool UTrace(TPrimaryFilter aPrimaryFilter, TUint32 a1,TUint32 a2, TUint32 a3);
inline TBool UTrace(TPrimaryFilter aPrimaryFilter, TUint32 a1,TUint32 a2, const TAny* aData, TInt aDataSize);
inline TBool UTrace(TPrimaryFilter aPrimaryFilter, TUint32 a1, const TAny* aData, TInt aDataSize);

inline TBool UTrace(TUint32 aSecondaryFilter,TPrimaryFilter aPrimaryFilter, TProgramCounter);
inline TBool UTrace(TUint32 aSecondaryFilter,TPrimaryFilter aPrimaryFilter, TUint32 a1, TProgramCounter);
inline TBool UTrace(TUint32 aSecondaryFilter,TPrimaryFilter aPrimaryFilter, TUint32 a1, TUint32 a2, TProgramCounter);
inline TBool UTrace(TUint32 aSecondaryFilter,TPrimaryFilter aPrimaryFilter, TUint32 a1, const TAny* aData, TInt aDataSize, TProgramCounter);
inline TBool UTrace(TUint32 aSecondaryFilter,TPrimaryFilter aPrimaryFilter, const TAny* aData, TInt aDataSize, TProgramCounter);

inline TBool UTrace(TPrimaryFilter aPrimaryFilter, TProgramCounter);
inline TBool UTrace(TPrimaryFilter aPrimaryFilter, TUint32 a1, TProgramCounter);
inline TBool UTrace(TPrimaryFilter aPrimaryFilter, TUint32 a1,TUint32 a2, TProgramCounter);
inline TBool UTrace(TPrimaryFilter aPrimaryFilter, TUint32 a1,TUint32 a2, TUint32 a3, TProgramCounter);
inline TBool UTrace(TPrimaryFilter aPrimaryFilter, TUint32 a1,TUint32 a2, const TAny* aData, TInt aDataSize, TProgramCounter);
inline TBool UTrace(TPrimaryFilter aPrimaryFilter, TUint32 a1, const TAny* aData, TInt aDataSize, TProgramCounter);
SWT uses two tags to identify a trace. The developer can use these tags to indicate which component the trace is originating from, if he wishes to do so.
A UID range can be specified so that the string tags is hashed into a number within this range. This allows the developer to filter SWT style traces based on the UID rather than primary filters.
SWTrace(const char* aTag, const* aSubTag, const char* aFormat, ...);
is translated into:
UTrace(aSwtUid, UTrace:EToolsSWT, aData, aSize);
|
|
An example of instrumented code:
#define KFileSystemTrace 0x10202930

EXPORT_C TInt RFile::Duplicate(const RFile& aFile, TOwnerType aType)
    {
    RFs fs;
    fs.SetHandle(aFile.Session().Handle());

    // Need to make a duplicate of the session handle in the current thread,
    // otherwise closing one session will close both sub-sessions.
    TInt r = fs.Duplicate(RThread(), aType);
    UTrace(KFileSystemTrace, UTrace::EAPI, r);
    if (r != KErrNone)
        return r;

    // duplicate the sub-session handle
    TInt dupSubSessionHandle;
    r = aFile.DuplicateHandle(dupSubSessionHandle);
    UTrace(KFileSystemTrace, UTrace::EAPI, r);
    if (r != KErrNone)
        return r;

    // adopt the duplicated sub-session handle
    Tint r = CreateAutoCloseSubSession(fs, EFsFileAdopt, TIpcArgs(dupSubSessionHandle));
    UTrace(KFileSystemTrace, UTrace::EAPI, r);
    return r;
    }
An example of code that has been compiled for function call logging using EDG. NOTE: The user will not be aware of this instrumentation as the resulting instrumented file is passed directly to the ARM compiler.
#define myComponentUID 0x12a53434
void ExampleClass::Foo(TInt aBar)
    {
    Tint enterExitStatus = 0;
    UTrace8(myComponentUID, UTrace::EToolsFunctionCall, GetFilenameAndLOCAsHashedInt32Id(), enterExitStatus);
    //some code
    enterExitStatus = 1;
    hash = GetFilenameAndLOCAsHashedId();
    UTrace8(myComponentUID, UTrace::EToolsFunctionCall, GetFilenameAndLOCAsHashedInt32Id(), enterExitStatus);
    }
An example of instrumented production release code.
#define myComponentUID 0x12a32345
void ExampleClass::Foo(TInt aBar)
    {
    //some code
    TInt error = GetError();
    UTrace4(myComponentUID, UTrace::EError, error);
    }
|
|
MasterTrace is both the controlling mechanism for what traces will be logged, and the output channelling tool. It is a command line tool, and an API that can be used from other applications and from TEF.
MasterTrace provides the default output channels: File,RDebugSerial and win32.
Only one output mechanism exists at any time because there is only one handler into BTrace. This means that either MasterTrace, or some other output mechanism can get output from BTrace, but not at the same time.
The developer enables the logging of the traces on the target either via the API or by running the command line tool on the target and telling it to log traces with the filters used in the trace statement.
//return channelID
InstallChannel(“NameOfDll”, “ReadableNameOfChannel”, extra data);
UnInstallChannel(channelID);

//this returns all channels existing in the system and their options
GetChannels();
EnableFilter(primary filter, secondary filter);
DisableFilter(primary filter, secondary filter);

//this returns all the enabled filters existing in the system
GetFilters();
Start(); //starts sending traces to output
Stop(); //stop sending traces to output, i.e. discard traces
The command line has the following functionality:
Install -c  [component dll name] [component name], returns [component id]

Uninstall -c [component id]

GetChannels, returns a list of all channels possible to use and their  settings

GetFilters, returns all enabled filters

EnableFilter –p [comma separated filters] –s [comma separated filters]

DisableFilter –p [comma separated filters] –s [comma separated filters]

Start

Stop
For example, this looks like the following:
c:\> Trace InstallChannel SWTFile.dll –o c:\logs\masterTraceLog.txt
The installed channel has the Id: 2

c:\> Trace EnableFilter –p CPU –s 0x2312333, 0x12332432

c:\> Trace GetChannels
Channel id 1: Serial, SWTSerial.dll, options: BaudRate 115200;
Channel id 2: File, SWTFile.dll, options: c:\logs\masterTraceLog.txt
Channel id 3: win32, SWTWin32.dll, options: -

c:\> Trace GetFilters
Primary filters: 2, 3, 5, 12, 23, 34, 35, 432, 324
Secondary filters: 0x1232334, 0x234234, 0x43345345345, 0x23443345, 0x32434534, 0x02342343, 0x023434543, 0x234345435, 0x924583945, 0x439834958, 0x893453475, 0x938493845, 0x9348938, 0x43984934, 0x93849435340,  0x394843985, 0x982374983, 0x9823984, 0x239898734, 0x345345, 0x03843485, 0x92349345, 0x9823493845, 0x03493485, 0x9834293485

c:\> Trace Start
………………………………………………………………….. .

c:\> Trace Stop
It is relatively easy to filter both at the component level and the data level. Filtering works by AND-ing the filters together.
For traces to be output they must satisfy both the primary AND secondary filter.
For Example:
Primary filter = Data Type T
Secondary filter = Component C
means that you only get traces of type T from component C.
Primary filter = Data Type T + Data Type U
Secondary filter = Component C + Component D
means you get all T and U type traces from both components C & D.
It is possible to enable/disable all traces at the same time, but this has serious implications on intrusiveness.
|
|
The log analyser takes the log files from MasterTrace and processes the data into a human readable format.
Each trace generates a record consisting of three parts: a header, header extensions, and the trace data itself.
The header consists of five bytes containing the size, flags, the primary filter, the deprecated sub-category and the secondary filter.
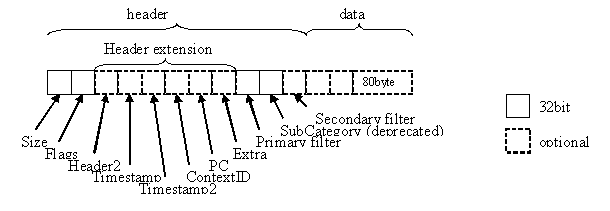
The size is the total number of bytes in the trace record including the header, header extension and trace data. Trace records are stored in memory word (32 bit) aligned. The size must be rounded up to a multiple of four when calculating the address of the next record. The maximum size is 80 bytes.
TUint8* record;   // pointer to a trace record
TInt size = record[BTrace::ESizeIndex];
record += (size+3); // move record pointer on to next record.
This is a bitmask of values from the
BTrace::TFlags enumeration. Bits 0 to 5 indicate which of
the 6 extension header words are present.
This contains flag values from the
BTrace::TFlags2 enumeration. A value is only present if
the EHeader2Present flag is set.
This is a timestamp value indicating when the trace was
generated. The format and resolution of this value are platform dependant. This
value is only present if the ETimestampPresent flag is set.
This provides additional timestamp information. For example, the
most significant half of a 64bit timestamp value. A Timestamp2 value can be
present even if the previous Timestamp is absent. This value is only present if
the ETimestamp2Present flag is set.
This value indicates the context in which the trace was generated. The meaning of the id is dependant on the contents of the two least significant bits:
00: indicates the value is the address of the
NThread object for the currently executing thread.
01: indicates Fast Interrupt (FIQ) context. Other bits of the value are currently reserved for future use.
10: indicates Interrupt (IRQ) context. Other bits of the value are currently reserved for future use.
11: indicates Immediate Delayed Function Call (IDFC) context. Other bits of the value are currently reserved for future use.
This value is only present if the EContextIdPresent
flag is set.
This is the memory address of the CPU instruction that follows
the location the trace was output. This value is only present if the
EPcPresent flag is set.
This is an extra value used for different purposes and is
dependent on the trace type. This value is only present if the
EExtraPresent flag is set. This is used mostly in multipart
messages.
Following the header extensions are 0 or more bytes of trace data, specified when the trace was output.
Example 1
If the trace was generated with the macro
UTrace4(aPrimaryFilter, aSecondaryFilter,a1), the data contains
the 4 bytes specified by the 32bit integer a1. (Data is always
little-endian.)
Example 2
If the trace was generated with the macro
UTrace8(aPrimaryFilter, aSecondaryFilter,a1,a2), the data contains
the 8 bytes specified by the two 32bit integers a1 and
a2.
Example 3
If the trace was generated with the macro UTraceN
(aPrimaryFilter, aSecondaryFilter,a1,aData,aDataSize), the data contains
the 4 bytes specified by the 32bit integer a1, the
aData specifies the number of bytes of additional data and the
aDataSize contains the additional data.
|
Copyright ©2008 Symbian Software Ltd. |
|
![[Top]](../../../a_stock/btn_top.gif)