The simplest kind of probe is simply to trace an event.
This is the effect of inserting strategically located print
statements into a program. This is often the first step of problem
solving: explore by seeing a history of what has happened.
This style of instrumentation is the simplest. It just asks systemtap to print something at each event. To express this in the script language, you need to say where to probe and what to print there.
Systemtap supports a number of built-in events. The library of
scripts that comes with systemtap, each called a ``tapset'', may
define additional ones defined in terms of the built-in family. See
the stapprobes man page for details on these and many other
probe point families. All these
events are named using a unified syntax with dot-separated
parameterized identifiers:
begin |
The startup of the systemtap session. |
end |
The end of the systemtap session. |
kernel.function("sys_open") |
The entry to the function named
sys_open in the kernel. |
syscall.close.return |
The return from the close system
call. |
module("ext3").statement(0xdeadbeef) |
The addressed instruction
in the ext3 filesystem driver. |
timer.ms(200) |
A timer that fires every 200 milliseconds. |
timer.profile |
A timer that fires periodically on every CPU. |
perf.hw.cache_misses |
A particular number of CPU cache misses have occurred. |
procfs("status").read |
A process trying to read a synthetic file. |
process("a.out").statement("*@main.c:200") |
Line 200 of the a.out program. |
Let's say that you would like to trace all function entries and exits
in a source file, say net/socket.c in the kernel. The
kernel.function probe point lets you express that easily, since
systemtap examines the kernel's debugging information to relate object
code to source code. It works like a debugger: if you can name or
place it, you can probe it. Use
kernel.function("*@net/socket.c").call for the function
entries1,
and kernel.function("*@net/socket.c").return for matching exits. Note
the use of wildcards in the function name part, and the subsequent
@FILENAME part. You can also put wildcards into the file name,
and even add a colon (:) and a line number, if you want to
restrict the search that precisely. Since systemtap will put a
separate probe in every place that matches a probe point, a few
wildcards can expand to hundreds or thousands of probes, so be careful
what you ask for.
Once you identify the probe points, the skeleton of the systemtap
script appears. The probe keyword introduces a probe point, or
a comma-separated list of them. The following { and }
braces enclose the handler for all listed probe points.
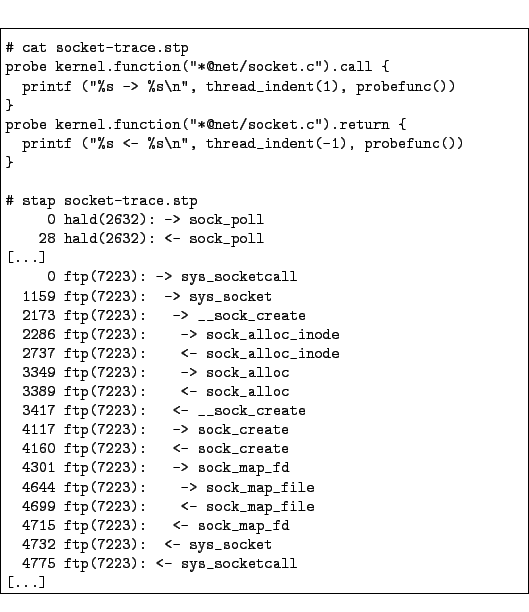
probe kernel.function("*@net/socket.c") { }
probe kernel.function("*@net/socket.c").return { }
You can run this script as is, though with empty handlers there will
be no output. Put the two lines into a new file. Run
stap -v FILE. Terminate it any time with ^C. (The
-v option tells systemtap to print more verbose messages during
its processing. Try the -h option to see more options.)
Since you are interested in each function that was entered and exited, a line should be printed for each, containing the function name. In order to make that list easy to read, systemtap should indent the lines so that functions called by other traced functions are nested deeper. To tell each single process apart from any others that may be running concurrently, systemtap should also print the process ID in the line.
Systemtap provides a variety of such contextual data, ready for
formatting. They usually appear as function calls within the handler,
like you already saw in Figure ![[*]](http://sourceware.org/systemtap/tutorial/crossref.png) . See the
. See the
function::* man pages for those functions and more defined in the
tapset library, but here's a sampling:
tid() |
The id of the current thread. |
pid() |
The process (task group) id of the current thread. |
uid() |
The id of the current user. |
execname() |
The name of the current process. |
cpu() |
The current cpu number. |
gettimeofday_s() |
Number of seconds since epoch. |
get_cycles() |
Snapshot of hardware cycle counter. |
pp() |
A string describing the probe point being currently handled. |
ppfunc() |
If known, the the function name in which this probe was placed. |
$$vars |
If available, a pretty-printed listing of all local variables in scope. |
print_backtrace() |
If possible, print a kernel backtrace. |
print_ubacktrace() |
If possible, print a user-space backtrace. |
The values returned may be strings or numbers. The print()
built-in function accepts either as its sole argument. Or, you can
use the C-style printf() built-in, whose formatting argument
may include %s for a string, %d for a number.
printf and other functions take comma-separated arguments.
Don't forget a "\n" at the end. There exist more printing /
formatting functions too.
A particularly handy function in the tapset library is
thread_indent. Given an indentation delta parameter, it stores
internally an indentation counter for each thread (tid()), and
returns a string with some generic trace data plus an appropriate
number of indentation spaces. That generic data includes a timestamp
(number of microseconds since the initial indentation for the thread), a
process name and the thread id itself. It therefore gives an idea not
only about what functions were called, but who called them, and how
long they took. Figure shows the finished
script. It lacks a call to the exit() function, so you need to
interrupt it with ^C when you want the tracing to stop.
-L option to systemtap to list all the kernel
functions named with the word ``nit'' in them.
syscall.NAME and
.return probe points), with the same thread_indent
probe handler as in Figure . Print parameters
using $$parms and $$return. Interpret the results.
by removing the .call
modifier from the first probe. Note how function entry and function
return now don't match anymore. This is because now the first probe
will match both normal function entry and inlined functions. Try
putting the .call modifier back and add another probe just for
probe kernel.function("*@net/socket.c").return
What printf statement can you come up with in the probe handler
to show the inlined function entries nicely in between the .call
and .return thread indented output?