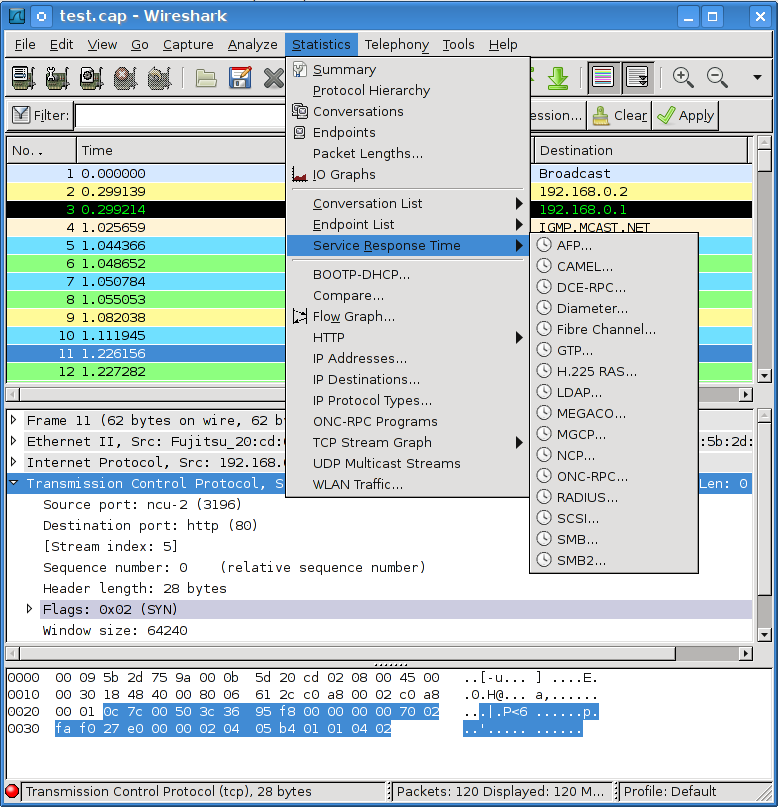
The Wireshark Statistics menu contains the fields shown in Table 3.8, “Statistics menu items”.
All menu items will bring up a new window showing specific statistical information.
Table 3.8. Statistics menu items
| Menu Item | Accelerator | Description |
|---|---|---|
| Summary | Show information about the data captured, see Section 8.2, “The "Summary" window”. | |
| Protocol Hierarchy | Display a hierarchical tree of protocol statistics, see Section 8.3, “The "Protocol Hierarchy" window”. | |
| Conversations | Display a list of conversations (traffic between two endpoints), see Section 8.4.2, “The "Conversations" window”. | |
| Endpoints | Display a list of endpoints (traffic to/from an address), see Section 8.5.2, “The "Endpoints" window”. | |
| Packet Lengths... | ||
| IO Graphs | Display user specified graphs (e.g. the number of packets in the course of time), see Section 8.6, “The "IO Graphs" window”. | |
| ------ | ||
| Conversation List | Display a list of conversations, obsoleted by the combined window of Conversations above, see Section 8.4.3, “The protocol specific "Conversation List" windows”. | |
| Endpoint List | Display a list of endpoints, obsoleted by the combined window of Endpoints above, see Section 8.5.3, “The protocol specific "Endpoint List" windows”. | |
| Service Response Time | Display the time between a request and the corresponding response, see Section 8.7, “Service Response Time”. | |
| ------ | ||
| BOOTP-DHCP... | ||
| Compare... | ||
| Flow Graph... | ||
| HTTP | HTTP request/response statistics, see Section 8.9, “The protocol specific statistics windows” | |
| IP Addresses... | ||
| IP Destinations... | ||
| IP Protocol Types... | ||
| ISUP Messages | ||
| ONC-RPC Programs | ||
| TCP Stream Graph | ||
| UDP Multicast Streams | ||
| WLAN Traffic |
