The Zenoss system brings together many types of monitoring and management information. The information is available through a standard web browser. In fact all aspects of the system are accessed though the web there is no need to edit configuration files. At a high level, Zenoss consists of four major parts:
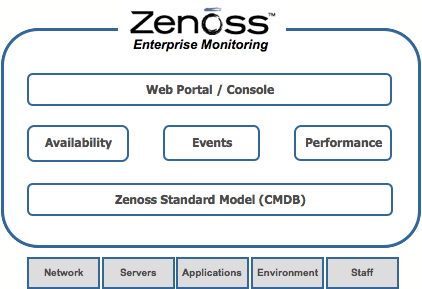
At the core of Zenoss is the Standard Model. The model is a detailed description of any device Zenoss manages and that device's relationship to your other devices, business units or any other important groupings you define. Because of the high degree of detailed information in the model, there are several ways the model's information is populated. The primary way information is added to the model is is through a process Zenoss calls "auto-discovery". Auto-discovery is defined as Zenoss using one of the available transports to discover the services, interfaces etc on a device. From this information, Zenoss builds a model of the device in the system. The model can also be populated by adding and manipulating data associated with the device though the web UI (or through Zenoss' external APIs). Version 2.0 adds discovery locking which allows auto-discovered information to be tightly integrated with manually added information. The model is used to drive all monitoring elements of the Zenoss system which will be described throughout the rest of this document.
Availability monitoring in Zenoss consists of the system running tests against the IT infrastructure to determine if it is currently functioning properly. These tests are typically run external to the monitored system. Examples tests include: ping tests, process tests, and service tests.
The Zenoss Event Management System is a consolidation of status information from all parts of the Zenoss system as well as any monitored external systems. When a Zenoss monitoring daemon detects a failure or threshold breach, events are generated. This is similar to most other monitoring systems available. Zenoss does more in that it also incorporates event imports from other parts of the IT infrastructure. These include Syslog and SNMP Traps. It is one thing to bring the events into a single repository but an event management system must do more. As events are received, Zenoss runs them through a set of rules that augment the information contained therein and integrates all of this information into the Zenoss Model.
The Zenoss Performance Management System tracks important IT resource information and tracks these changes over time. It is critical to know how much disk space is available, what the CPU load is, or how long a web page takes to download. Zenoss can collect information using SNMP, custom scripts (ZenCommands) or XML-RPC. Performance information is integrated with the Zenoss Model so that resource usage is shown in the context of other Zenoss information.