You can customize the Zenoss Dashboard by selecting and arranging various portlets that display different information about the system. You can also arrange how the portlets appear on the screen.
To set the arrangement of the portlets on the dashboard, from the top right hand side of the Dashboard, select Configure layout. The Column Layout dialog appears.
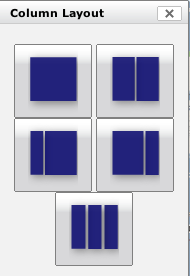
Select the column layout for your dashboard. Once you have selected the column layout, you can then drag and drop the portlets wherever you want on those grids.
To select which portlets you want to see on the dashboard: From the Zenoss Dashboard, in the top right, select Add Portlet. The Add Portlet dialog appears.
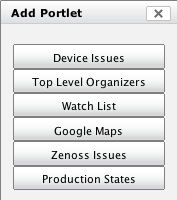
Select the portlets you want to appear on the dashboard from the list. Available portlets include:
-
Device issues
-
Top level Organizers
-
Watch List
-
Google Maps
-
Zenoss Issues
-
Production States
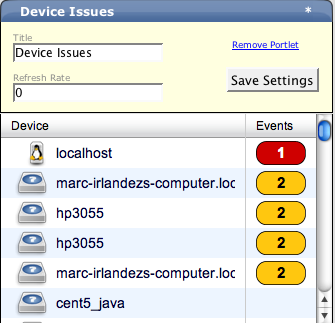
This section displays the name of the device, the acknowledged status, and amount of Critical and Error severity level events. “Devices” can be clicked on to take you to the Devices event log, which is default sorted by severity. Clicking on the specific device will take you to the device log of that device. The events are shown in fractions of acknowledged/total. If they are acknowledged it shows the user that acknowledged it.
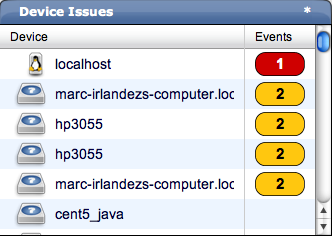
To configure the information that appears in the Device Issues Portlet click the asterisk in the top right of the portlet window. A drop down configuration dialog appears where you can change the information for this portlet. You can change the Title of the portlet or the Refresh Rate. This is also how you remove the portlet from the Dashboard.
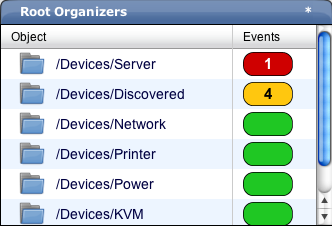
The Top Level Organizers portlet shows all of the organizers at the top level of the hierarchy so you can see summary events for each organizer.
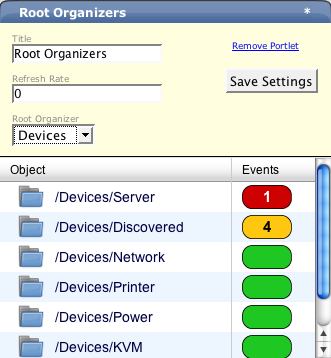
To configure the information that appears in the Top Level Organizer Portlet click the asterisk in the top right of the portlet window. A drop down configuration dialog appears where you can change the information for this portlet. You can change the Title of the portlet or the Refresh Rate, and also choose which Root Organizer you want to display. This is also how you remove the portlet from the Dashboard.
The Watch List Portlet shows a Device Watch List you can configure a list of watch devices an also the refresh rate for the gathering data for devices in the list.
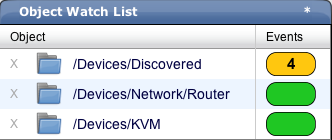
To configure the information that appears in the Device Issues Portlet click the asterisk in the top right of the portlet window. A drop down configuration dialog appears where you can change the information for this portlet. You can change the Title of the portlet or the Refresh Rate. This is also how you remove the portlet from the Dashboard. You can also add or remove devices from the Watch List here.
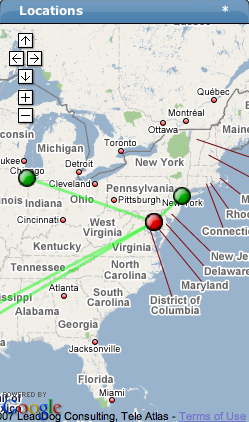
The Google Maps Portlet allows you to see the Location map with Location you have set up and network connection statuses. Here is a look at the Google Maps portlet.
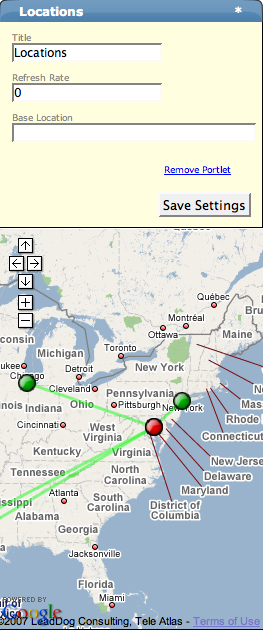
To configure the information that appears in the Device Issues Portlet click the asterisk in the top right of the portlet window. A drop down configuration dialog appears where you can change the information for this portlet. You can change the Title of the portlet or the Refresh Rate. This is also how you remove the portlet from the Dashboard. You can also set the Base Location here.
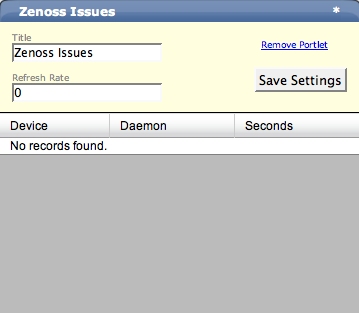
Zenoss Infrastructure Issues will show any problems with a Zenoss daemon. Heartbeats statuses of the Zenoss daemons appear here when there is a problem. If an issue appears in this list, it could be that the daemon is not running.

To configure the information that appears in the Device Issues Portlet click the asterisk in the top right of the portlet window. A drop down configuration dialog appears where you can change the information for this portlet. You can change the Title of the portlet or the Refresh Rate. This is also how you remove the portlet from the Dashboard.
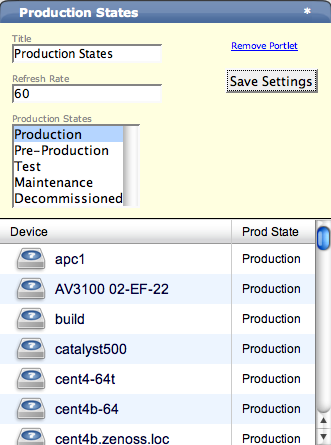
The Production States Portal allows you to see all of the devices in a given Production State.
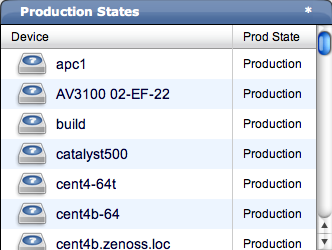
To configure the information that appears in the Device Issues Portlet click the asterisk in the top right of the portlet window. A drop down configuration dialog appears where you can change the information for this portlet. You can change the Title of the portlet or the Refresh Rate. This is also how you remove the portlet from the Dashboard. You can also choose what Production States you want to appear on the Dashboard here.