Zenoss includes several methods for monitoring performance metrics of devices and device components. ZenPerfSNMP collects data via SNMP from any device configured properly for SNMP monitoring. ZenCommand can login to devices via telnet or ssh and run scripts to collect perforamnce data. ZenPacks can provide additional means of collecting performance data. Examples include ZenJMX which collects data from enterprise java applications and HttpMonitor which checks the availability and responsiveness of web pages. Regardless of the monitoring method used, configuration information is stored in Performance Templates.
The following image shows that graph as it appears in the Perf tab.
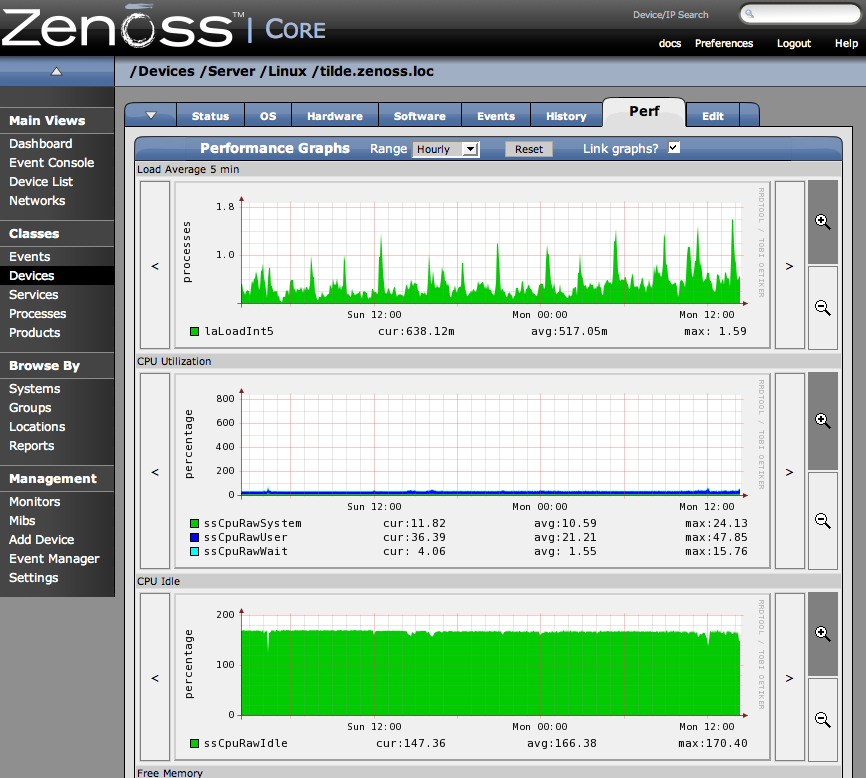
The Performance Template for this Load Average 5 minutes graph (as for any other graph appearing on the Perf tab) can be found by opening the Device page menu, choosing More.. and then the Templates option and then clicking the name of the template.