Zenoss also excels at aggregating and reporting on data over time for any of the data you have set it up to monitor.
The kinds of Reports that are available include:
-
Summary Reports for performance information (CPU, memory, i/o pages, load average, network interface utilization)
-
Performance threshold summary reports
-
Go through the history events and calculate the percentage uptime for device and is components.
-
Availability report of any event class
-
Ping Issues
-
SNMP Issues
-
SLA Reporting
-
Graphing of trend over time: hourly, weekly, monthly, yearly
-
Other Performance Reports
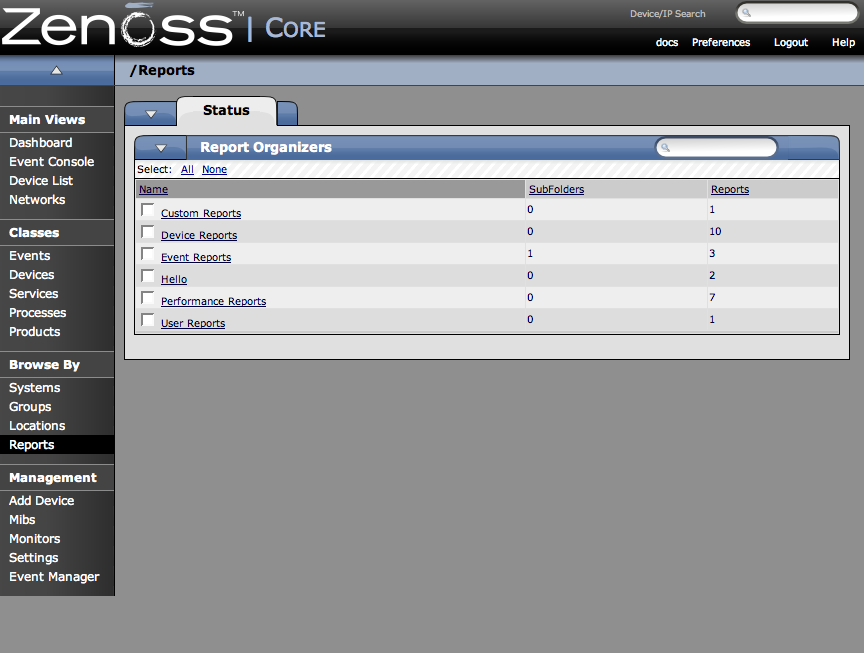
To see the Reports area of Zenoss, from the left navigation click Reports. The Reports organizer list appears.